buildings screened roof by roof from 1 m LiDAR in one run, in Great Baddow, Chelmsford
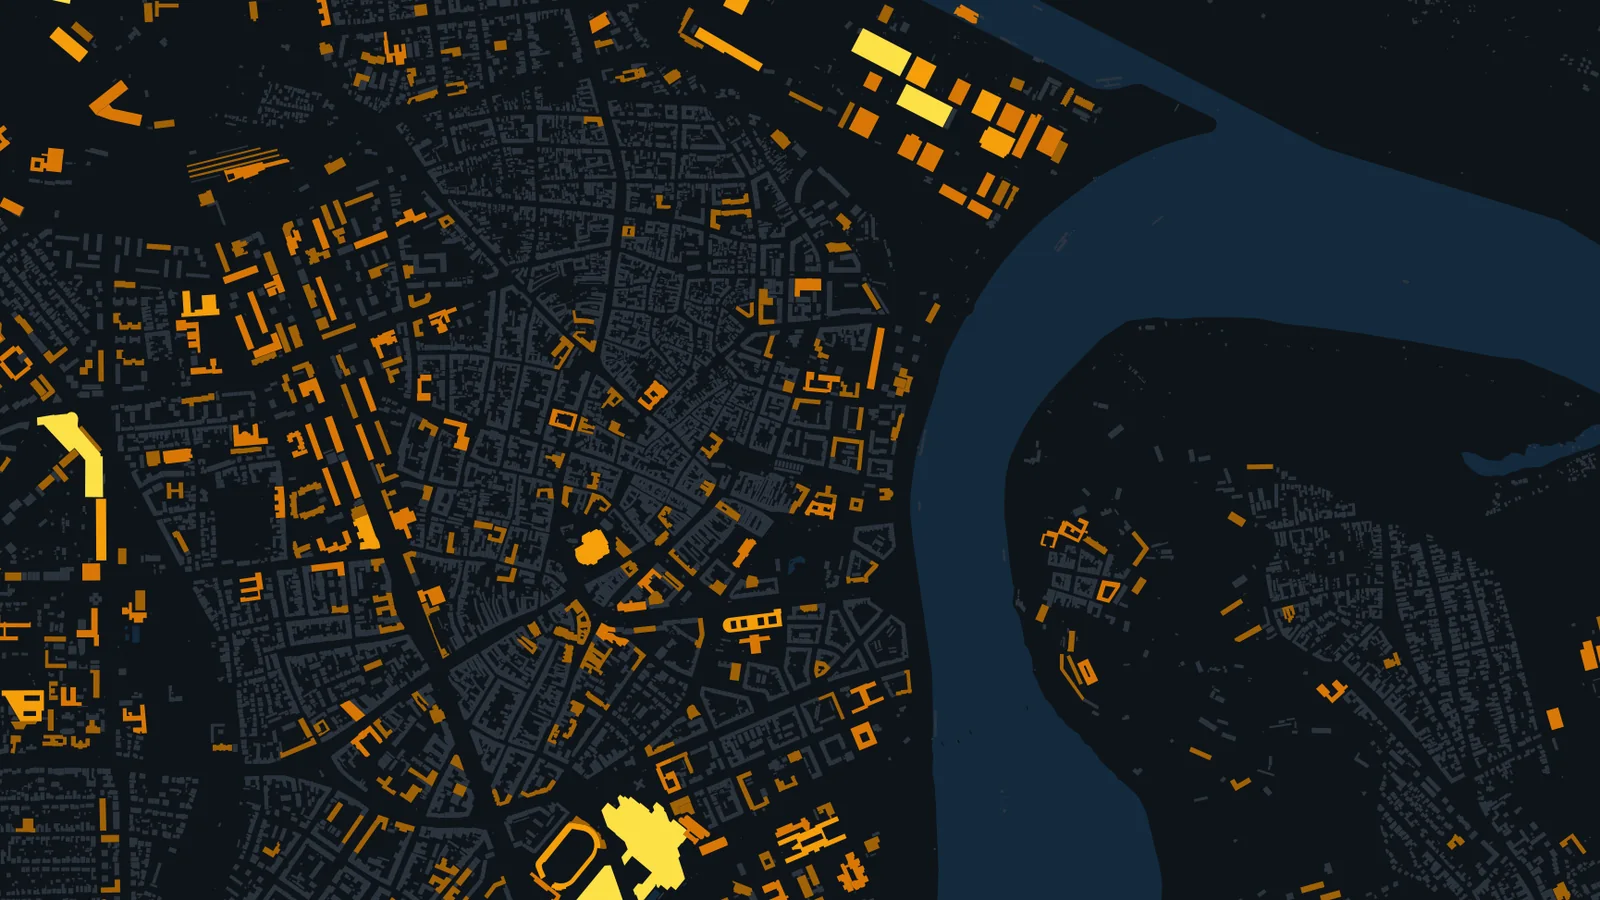
See the exampleroofs of 1,000 m² or more mapped in 28.5 km² of Novi Sad, Serbia, from open data
See the examplemore yearly output per kWp in Novi Sad than in London, for the same 10° south-facing frame (PVGIS)
See the exampleWhich roofs are worth it?
Roofs are the easiest place to add solar: the building is already there, the power is used on site and no land is taken. The hard part is knowing which roofs are worth a visit. We apply one method to every building, combining building outlines, the shape of each roof where a surface model exists and solar yields from the European Commission's PVGIS, and rank every roof by what it could generate, with a plain note of what was assumed.
It is the same work for a solar installer looking for commercial roofs to approach, a landlord deciding which buildings in a portfolio to fit first, or a council planning panels across its schools and offices.
What you get
Three stages, each ending in something you can use
Start with the stage that answers your question. Most projects begin with an area screen and go deeper only on the roofs that make the shortlist.
Area screen
Every roof in a city, region or country, from building outlines and PVGIS solar yields. Large flat roofs (factories, warehouses, schools, retail) hold most of the power and screen well without 3D data, so this works even where there is no national LiDAR.
You'll see: a ranked roof list and a map of the whole area.
Roof by roof
The pitch and direction of every square metre of roof, from 1 m LiDAR (free across England) or a surface model made from aerial or satellite stereo imagery. South, east and west faces, flat roofs and unsuitable parts, with shading from nearby buildings and trees as an option.
You'll see: a roof suitability map and figures for each building.
Site report
For the buildings you want to pursue: a detailed roof survey (a drone survey flown by a partner drone operator where needed), usable area around plant, skylights and edges, an indicative panel layout and yield, and the checks still needed on roof structure and grid connection.
You'll see: a site report per building, ready for your installer's design.
What the ranked roof list looks like
The top five non-residential roofs from the Novi Sad example below, straight from the area screen. A full list has every roof, with building use, location and both ends of each range.
| Rank | Use (as mapped) | Roof area (m²) | Indicative peak power (kWp) | MWh a year |
|---|---|---|---|---|
| 1 | Commercial | 43,900 | 3,070 to 5,270 | 5,100 |
| 2 | Retail | 25,730 | 1,800 to 3,090 | 2,990 |
| 3 | Commercial | 24,960 | 1,750 to 3,000 | 2,900 |
| 4 | Commercial | 22,130 | 1,550 to 2,660 | 2,570 |
| 5 | Commercial | 18,960 | 1,330 to 2,270 | 2,200 |
Peak power at 0.07 to 0.12 kWp per m² of roof; MWh a year at the central 0.10 kWp per m² and 1,162 kWh per kWp (PVGIS). Upper bounds before structure, shading and grid checks.
Great Baddow, Chelmsford: every roof, from 1 m LiDAR
Our Rooftop Solar Screening model worked out the pitch and direction of every roof cell inside 1,910 building outlines from the Environment Agency's 1 m LiDAR, then gave each building its suitable roof area, indicative peak power and yearly generation.
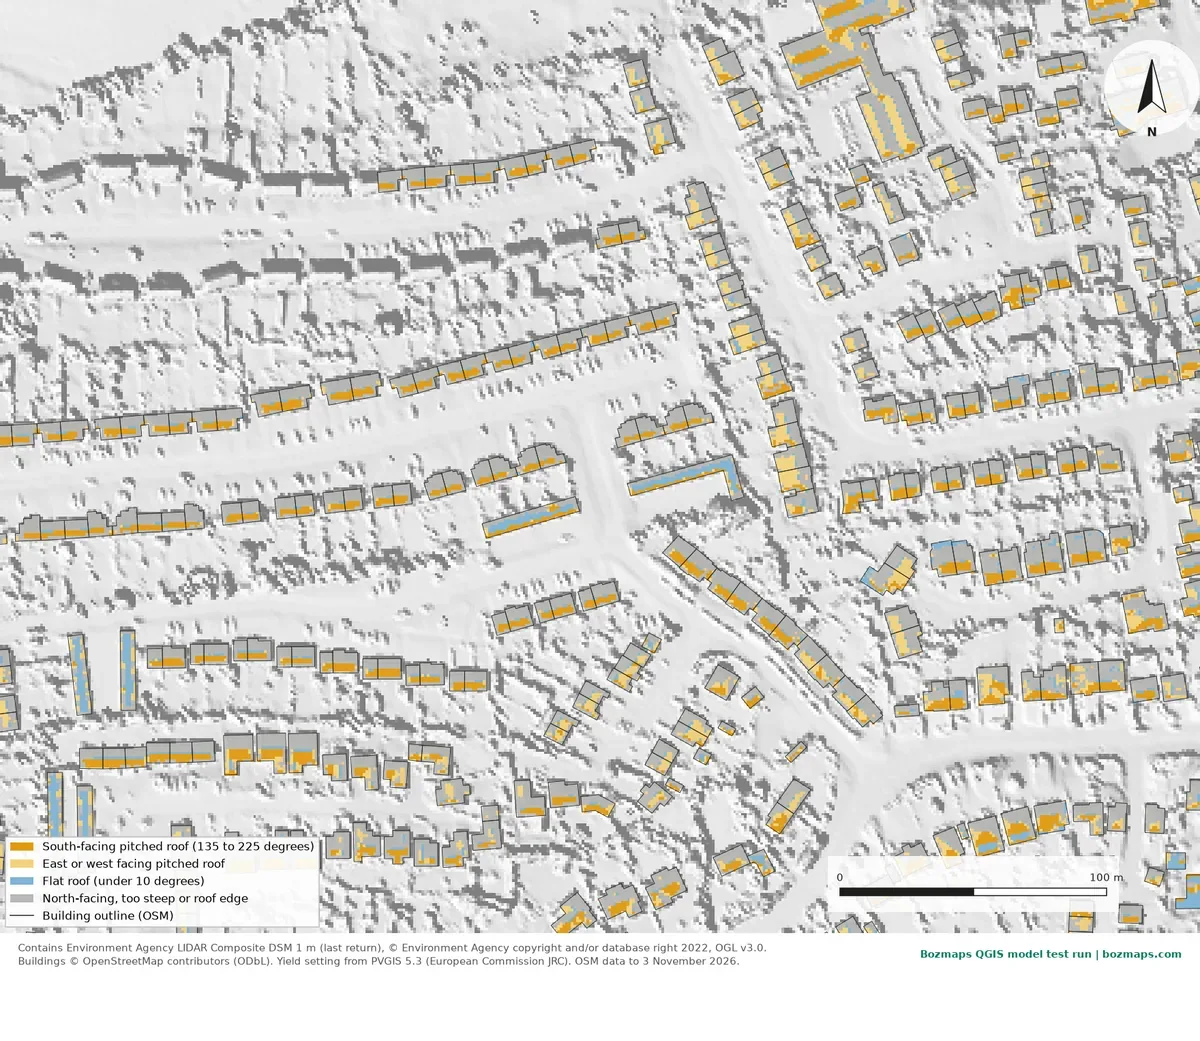
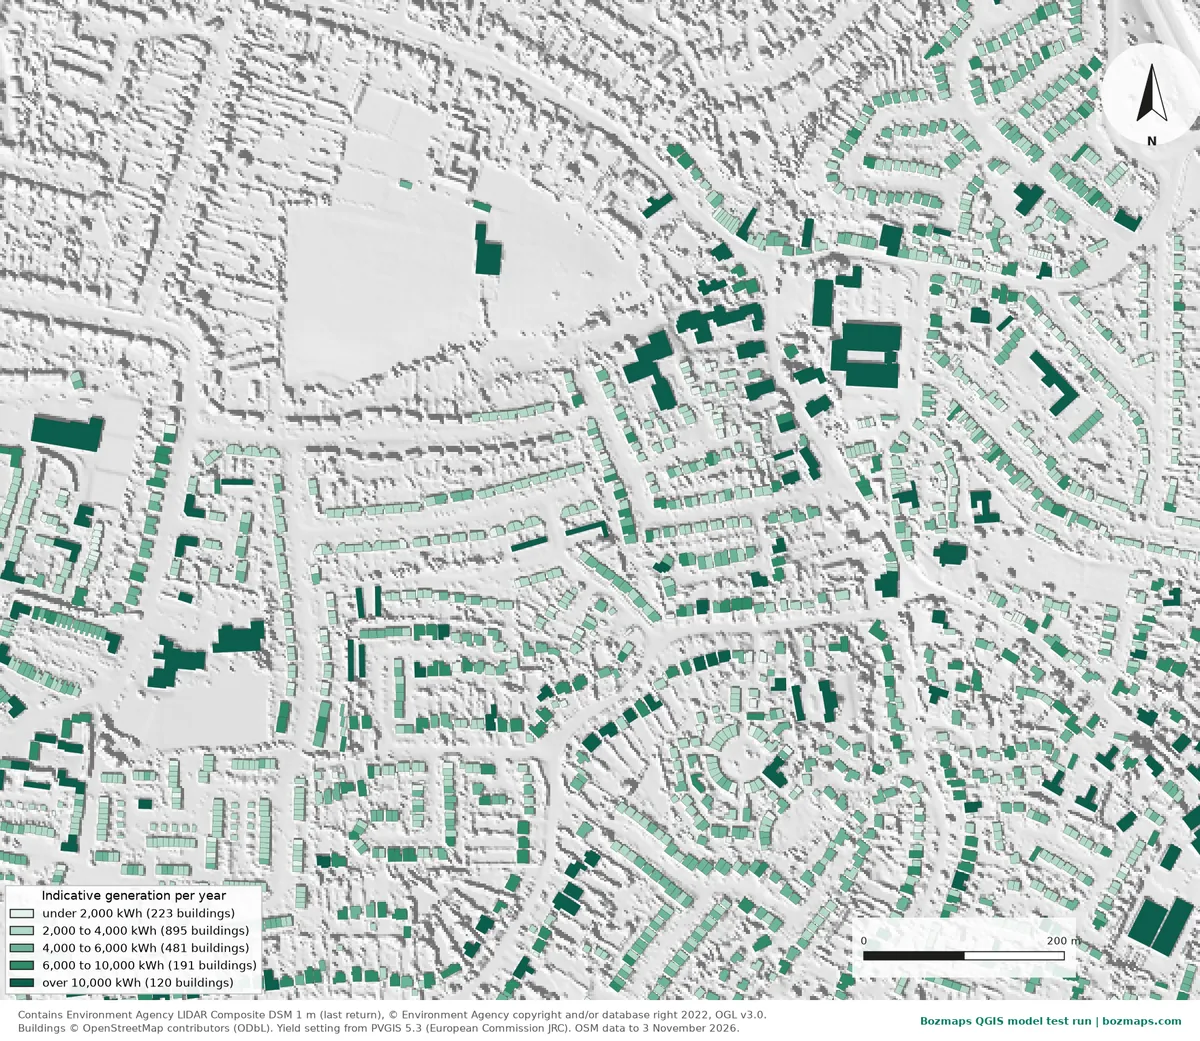
Settings: 0.18 kWp per m² of suitable roof, 950 kWh per kWp a year, east and west roofs 17.5% lower; shading and roof structure not modelled in this run. Contains Environment Agency LIDAR Composite DSM 1 m, © Environment Agency copyright and/or database right 2022, OGL v3.0. Buildings © OpenStreetMap contributors (ODbL). Yield setting from PVGIS 5.3 (European Commission JRC). Model run 10 November 2026.
Novi Sad: an area screen from open data
Serbia has no free national LiDAR, so we screened from building outlines alone. In 28.5 km² of Novi Sad, 790 of 16,604 buildings have roofs of 1,000 m² or more, and 320 of those are non-residential, with 0.97 million m² of roof between them.
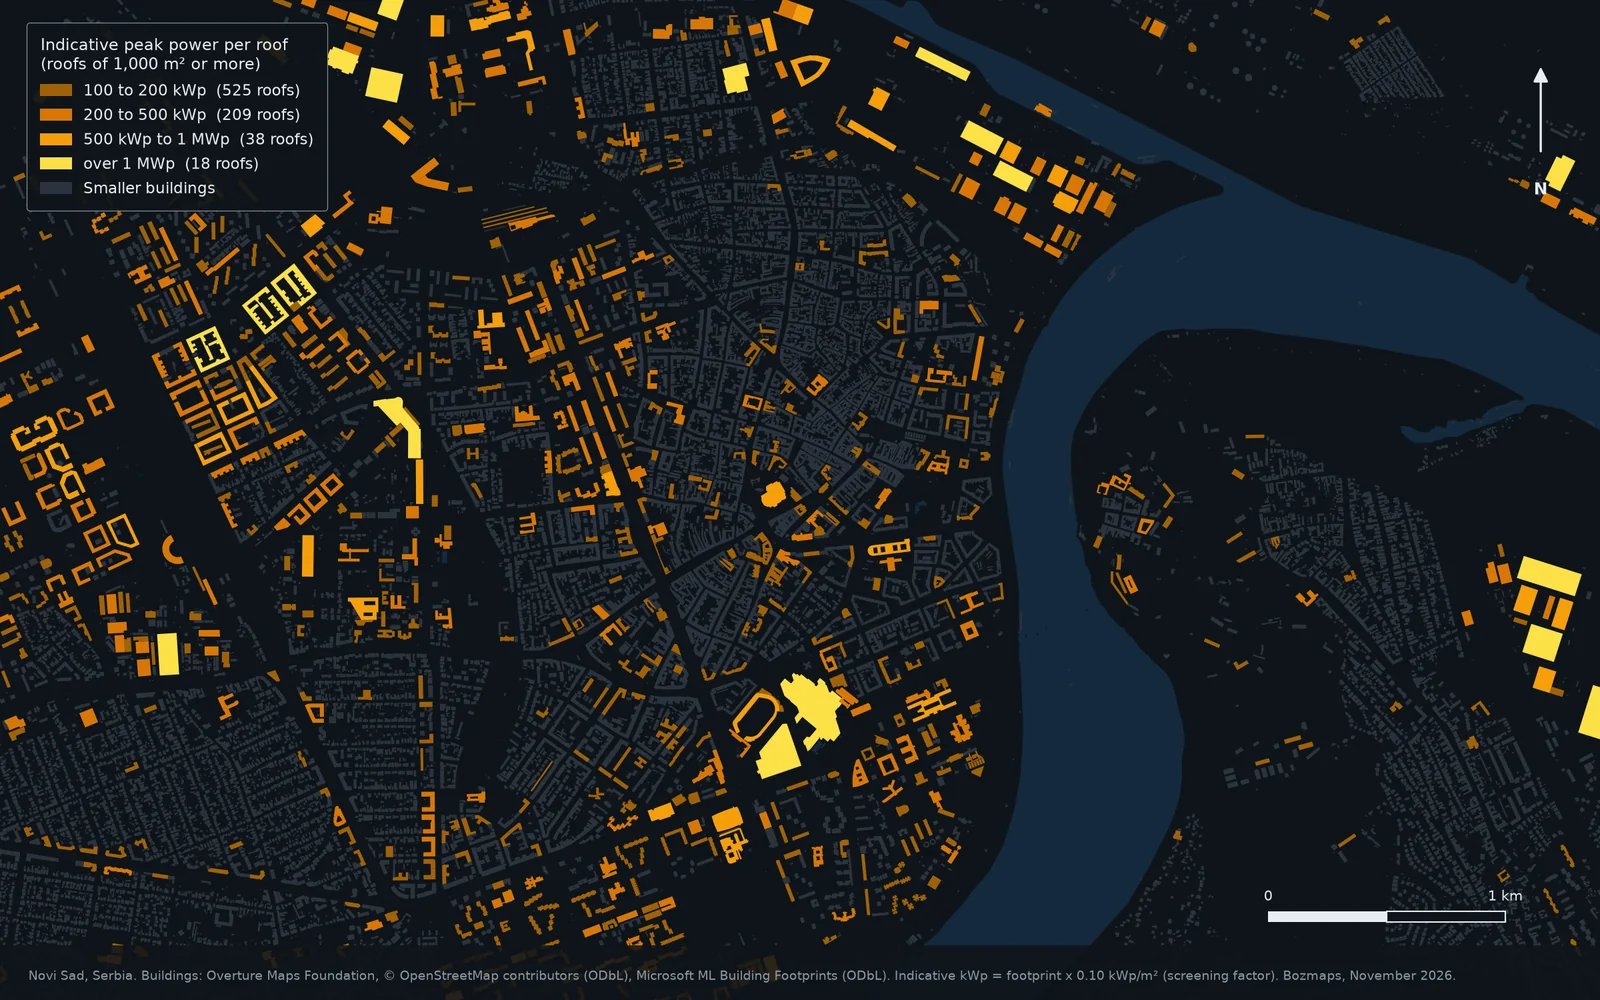
- 100 to 200 kWp(525 roofs)
- 200 to 500 kWp(209 roofs)
- 500 kWp to 1 MWp(38 roofs)
- over 1 MWp(18 roofs)
- Smaller buildings
Yields: PVGIS 5.3 (European Commission JRC), SARAH3 radiation data, 14% system losses, 10° south-facing frame, queried 13 November 2026.
Who it is for
Tools we use
Data we use
Building outlines
UK: OpenStreetMap, Ordnance Survey where licensed
Serbia and Europe: Overture Maps (OpenStreetMap and Microsoft building footprints), national cadastre where licensed
Roof shape
UK: Environment Agency 1 m LiDAR (England), national LiDAR in Scotland and Wales
Serbia and Europe: National LiDAR where it exists and can be licensed, stereo satellite or aerial imagery, drone surveys
Solar yield
UK, Serbia and Europe: PVGIS 5.3 (European Commission Joint Research Centre), checked for every location
Questions
How accurate is a solar rooftop analysis?
Each stage says what it assumes. An area screen is an upper bound: it assumes the roof can carry panels and is not shaded. Roof-by-roof analysis measures pitch and direction from a surface model, and a site report adds the roof's real obstructions. No stage replaces an installer's structural survey or the grid operator's connection offer, and every report says so.
Do you need LiDAR to map rooftop solar potential?
Not for the first stage. An area screen needs only building outlines, which exist for most of Europe. England has free 1 m LiDAR for roof-by-roof work; elsewhere we use national surface models where they can be licensed, surface models made from stereo imagery, or a drone survey for single sites.
Which countries do you cover?
The UK and Europe, including Serbia, Bosnia and Herzegovina and the rest of the Western Balkans. PVGIS covers all of Europe and open building outlines cover most of it; we check coverage for your area before we start.
Can I run a rooftop solar screen myself?
Yes, for one area at a time: our Rooftop Solar Screening QGIS model does the roof-by-roof step from a LiDAR surface model and building outlines. It is the model behind the Great Baddow example on this page.
What does it cost?
Every job is priced for your project. We agree one fixed price in writing before any work starts, with no hidden fees.
Start with your area
Tell us the area, the buildings or the portfolio, and what you need to decide.
Or write to semir@bozmaps.com
Related: Energy and methane · Drone mapping · Rooftop Solar Screening QGIS model