This advanced QGIS model automates the full workflow for wildfire impact assessment using Sentinel-2 imagery. Designed for analysts, responders, and researchers, the model integrates key spectral indices and geospatial analysis tools to rapidly detect, classify, and quantify burn severity and its impact on infrastructure.
✅ Key Features:
Automated Calculation of wildfire indices:
NBR, NBR2, MIRBI, BAIS2, NDVI, GEMI, and Moisture Stress Index
Burn Area Classification using threshold-based raster math
Polygonization of burned zones and active fire fronts
Impact Assessment:
Area Statistics with burned surface summaries
Spreadsheet Export for reporting and decision-making
🛰️ Input:
🧭 Output:
Burned area vector layers
Infrastructure-at-risk layers
Thematic raster outputs for each index
Tabular reports in Excel format
Whether you're mapping recent wildfires or building your own burn severity monitoring toolkit, this model offers a robust, no-code solution for repeatable, scalable analysis — 100% open source.
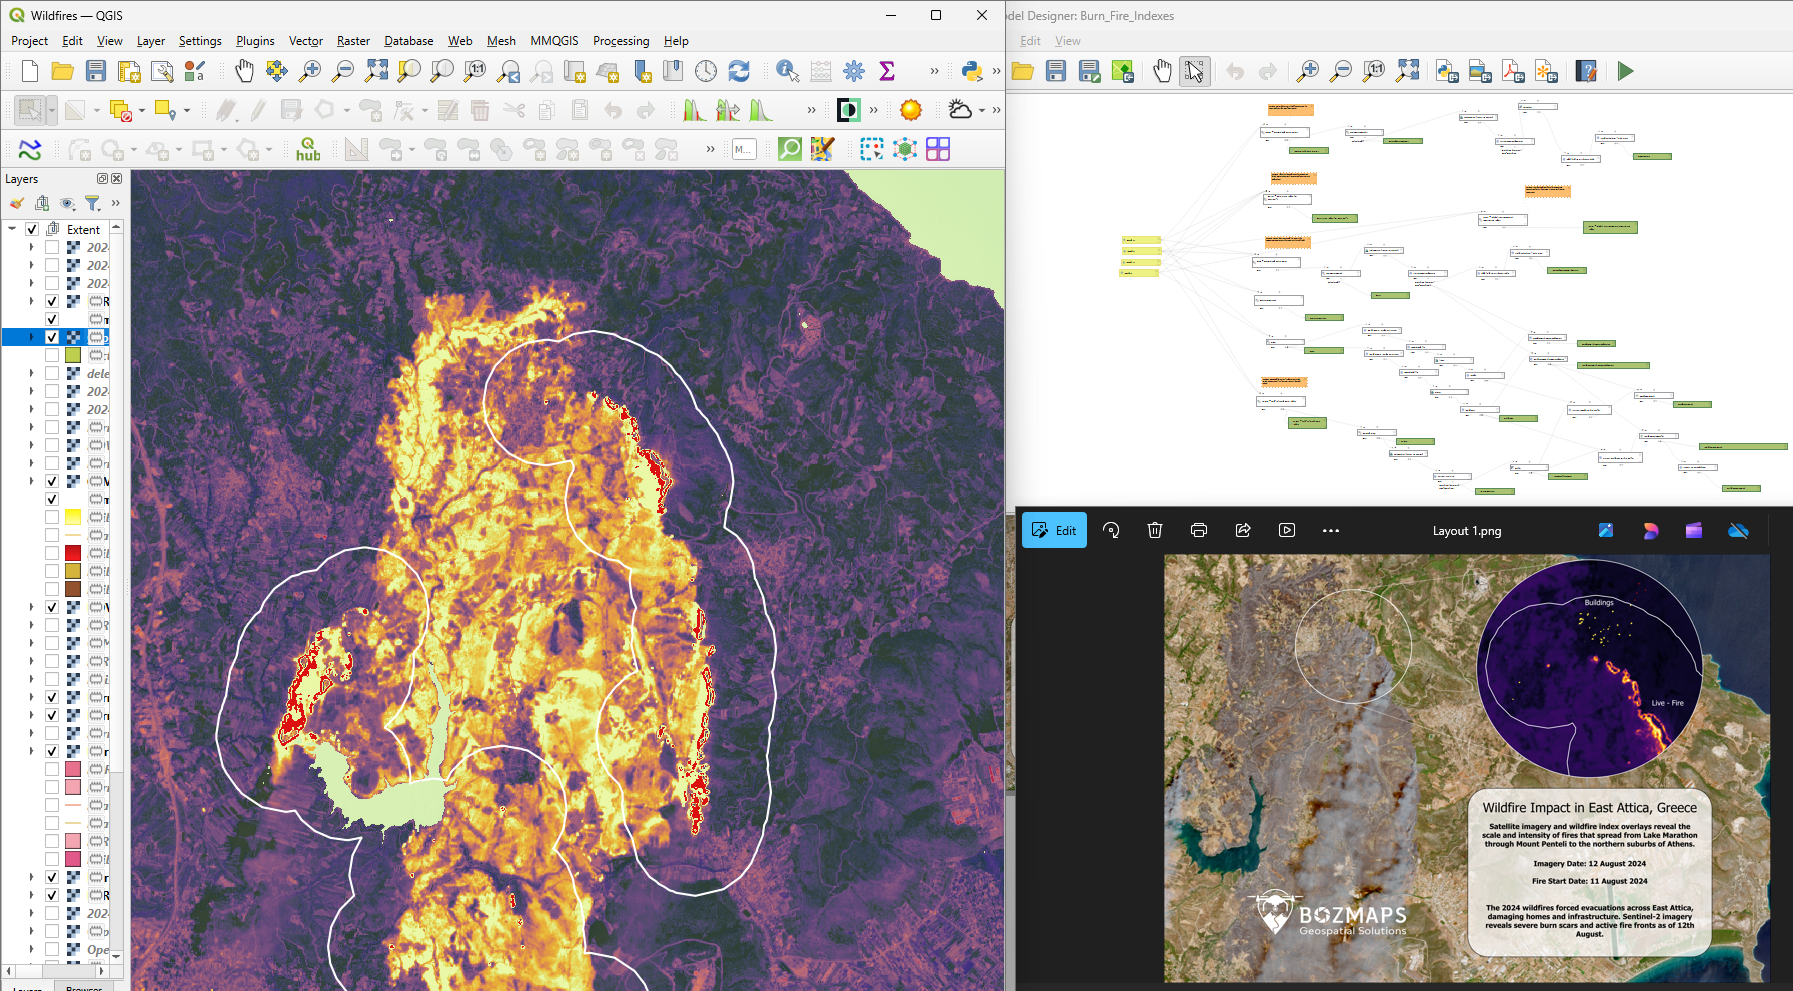 Image 1 of 7
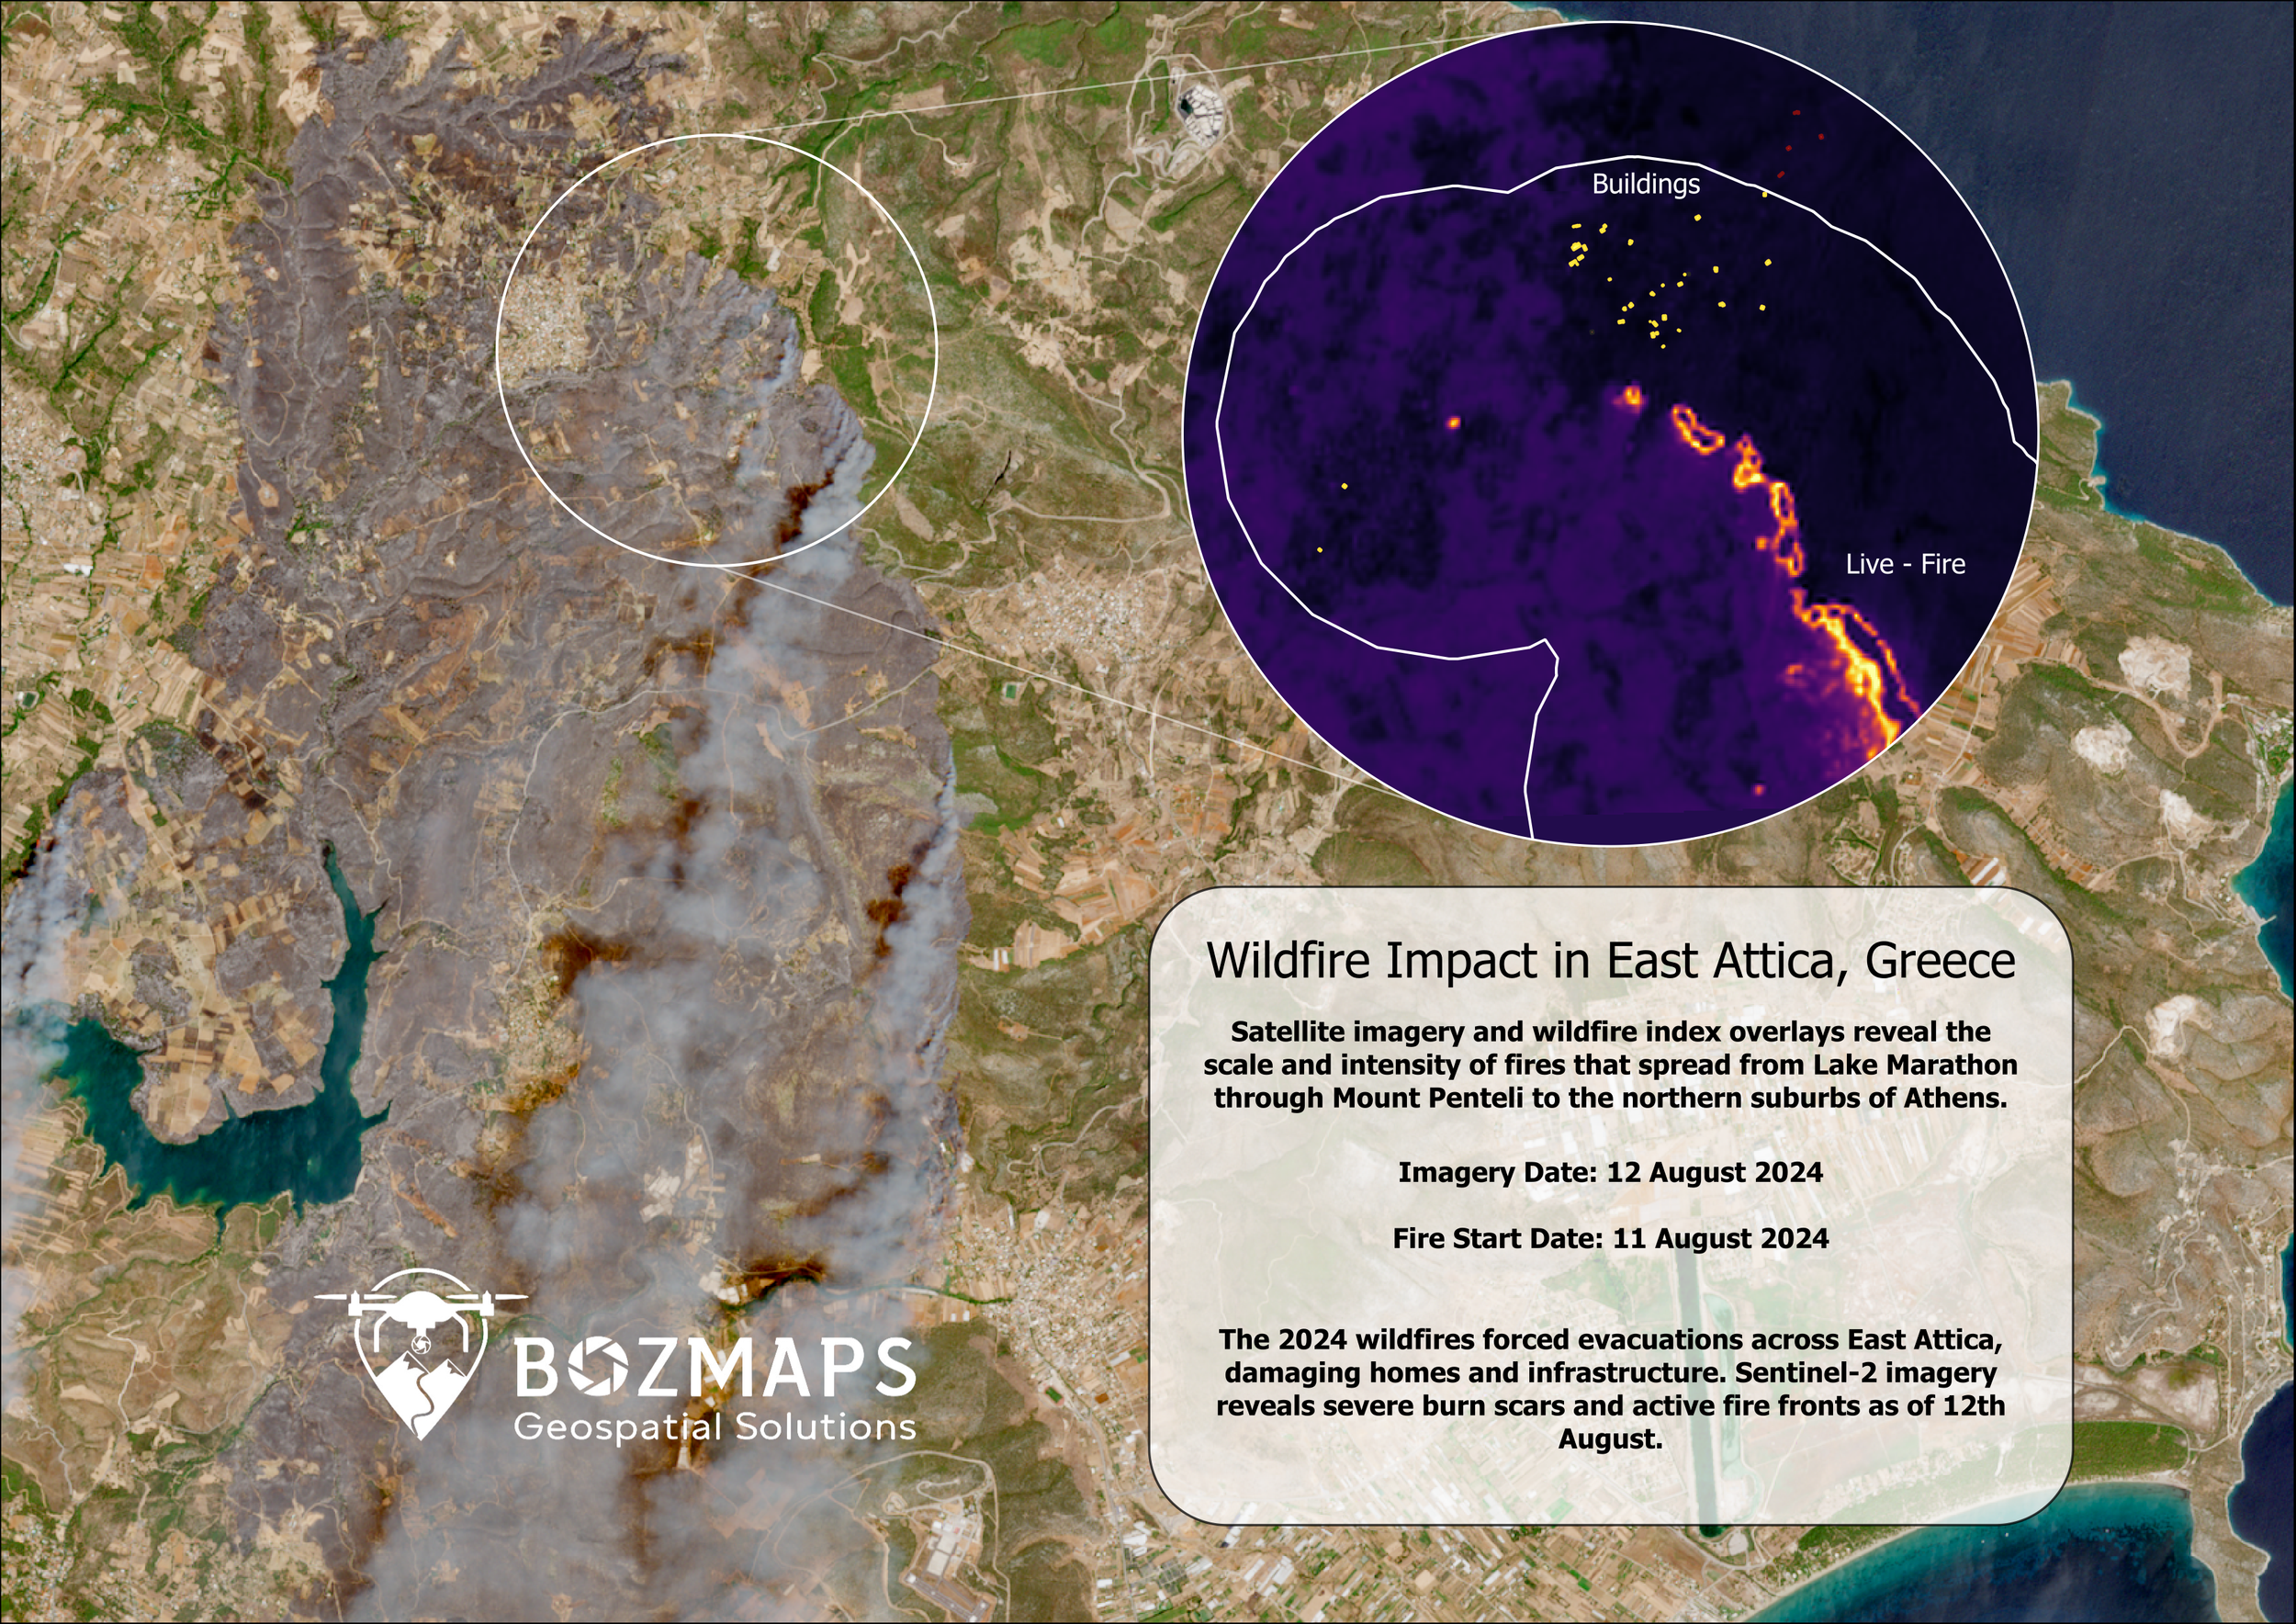 Image 2 of 7
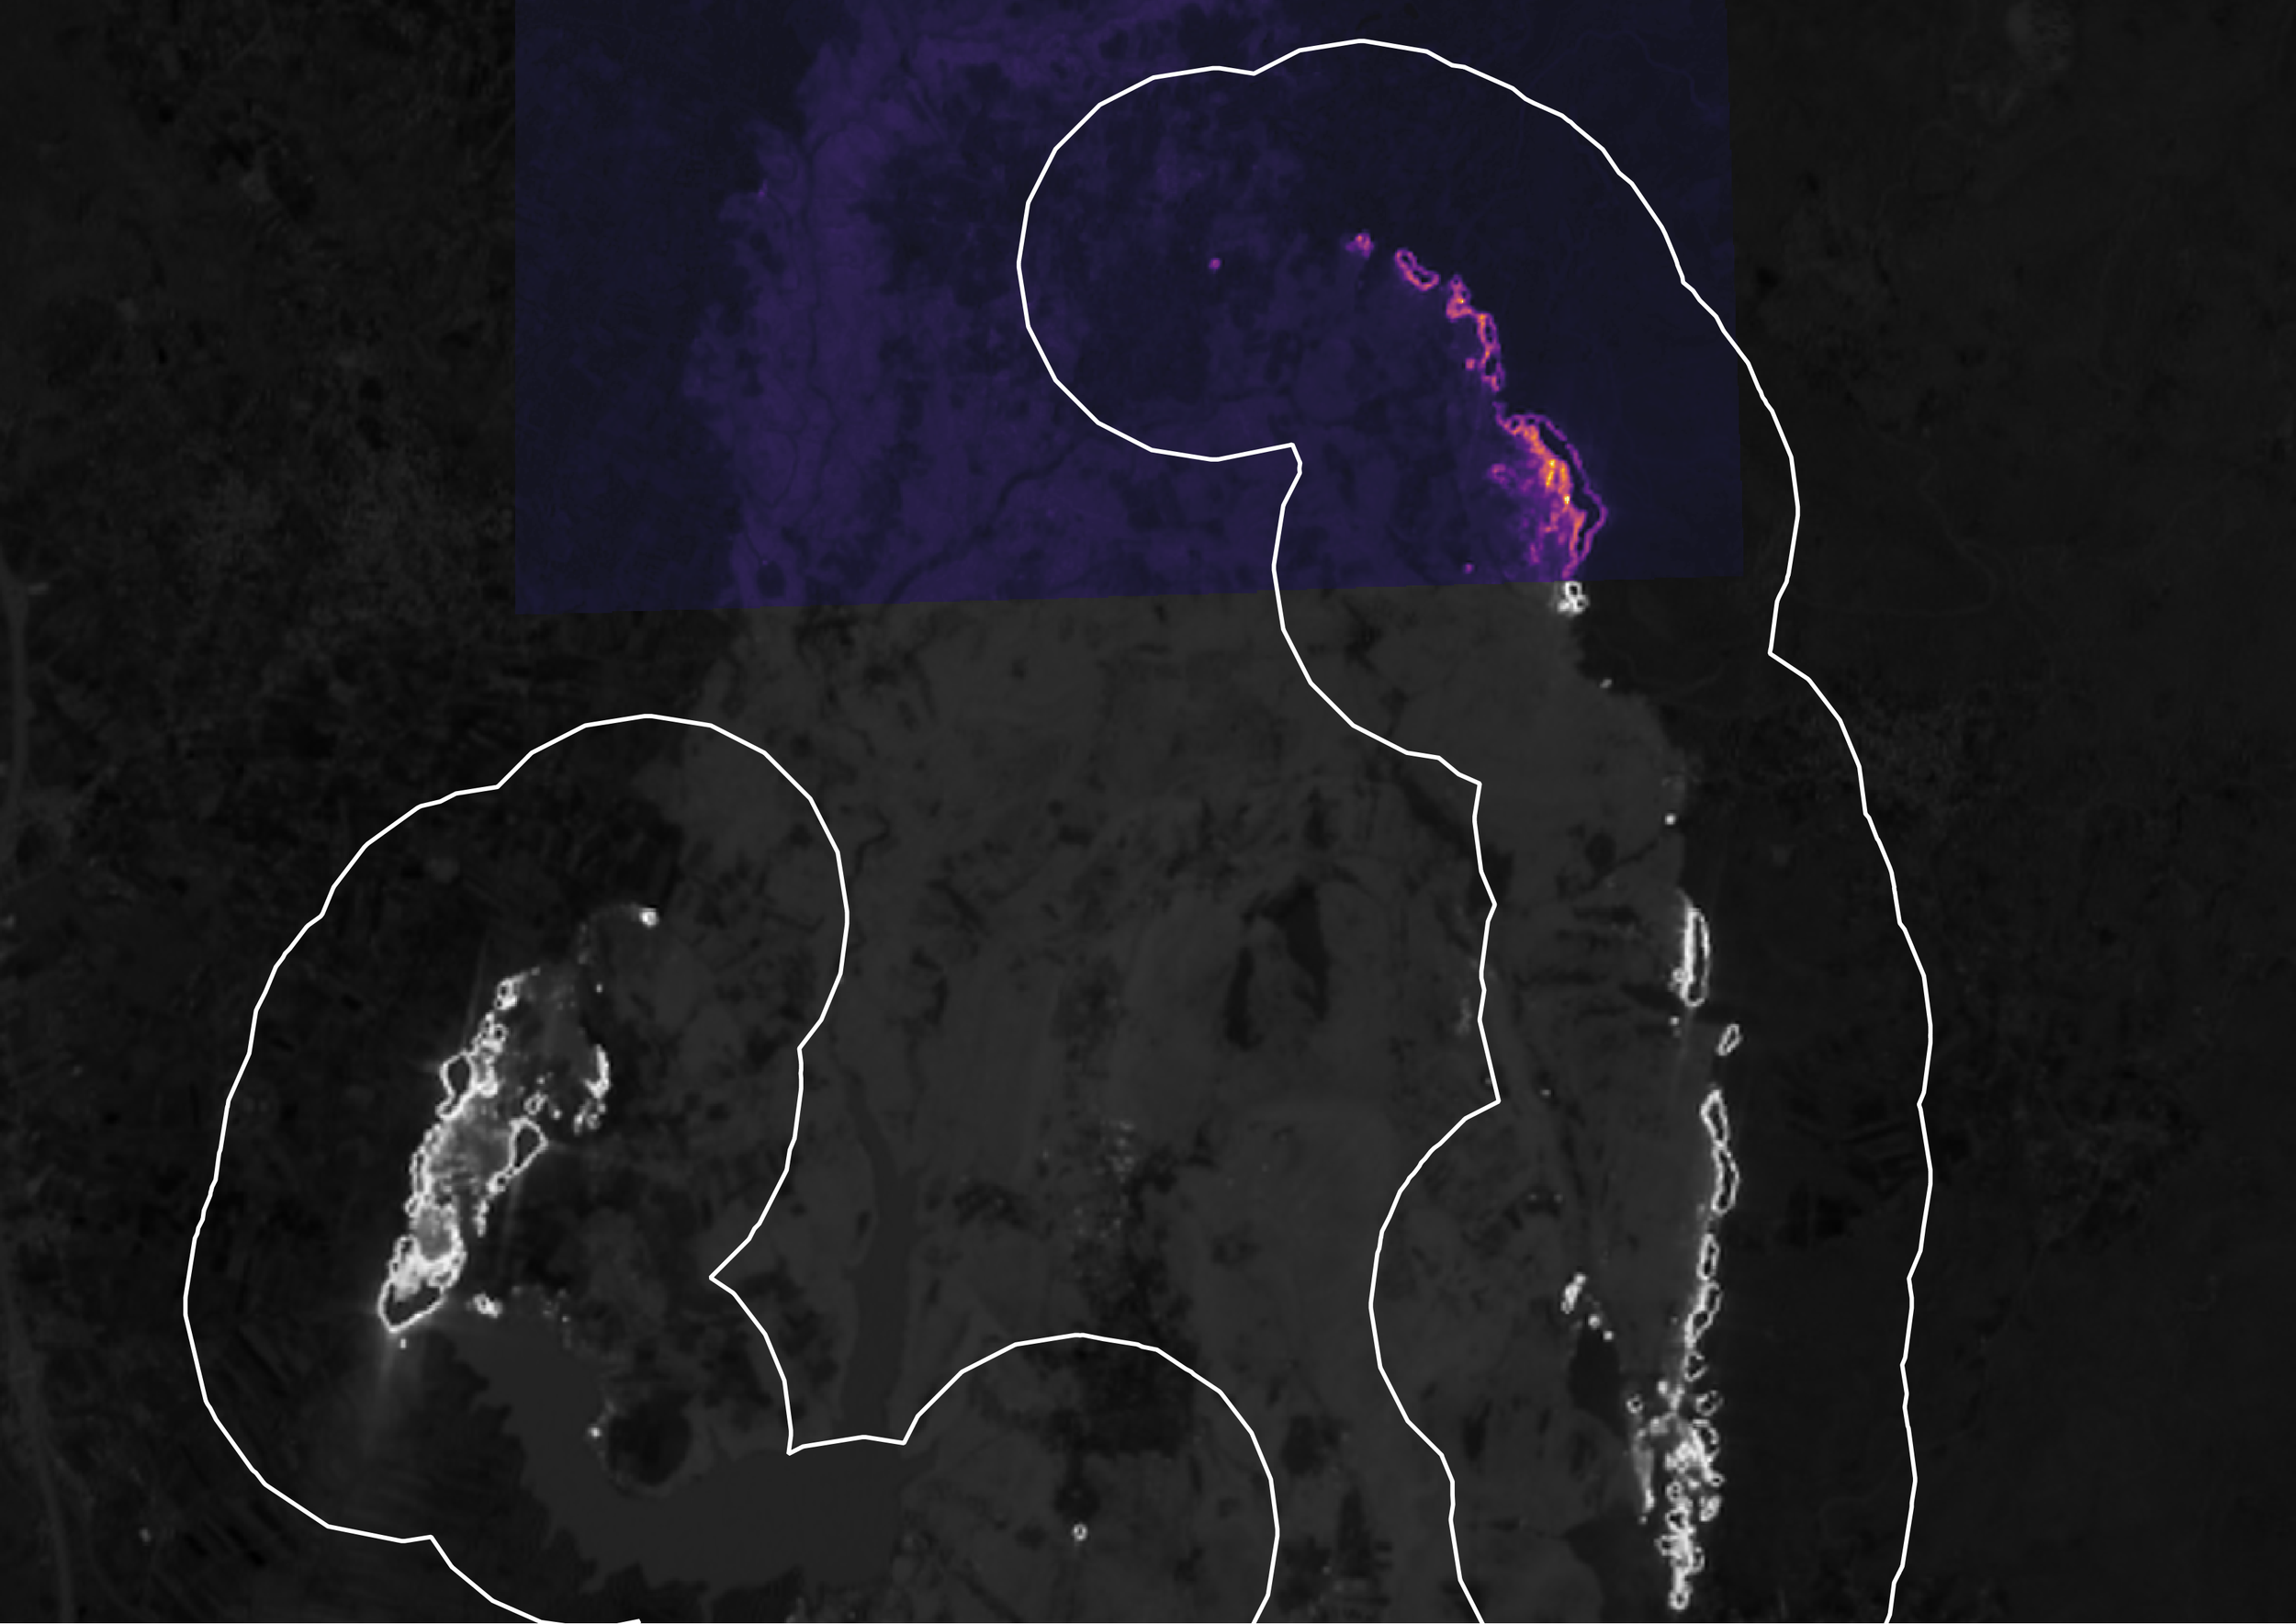 Image 3 of 7
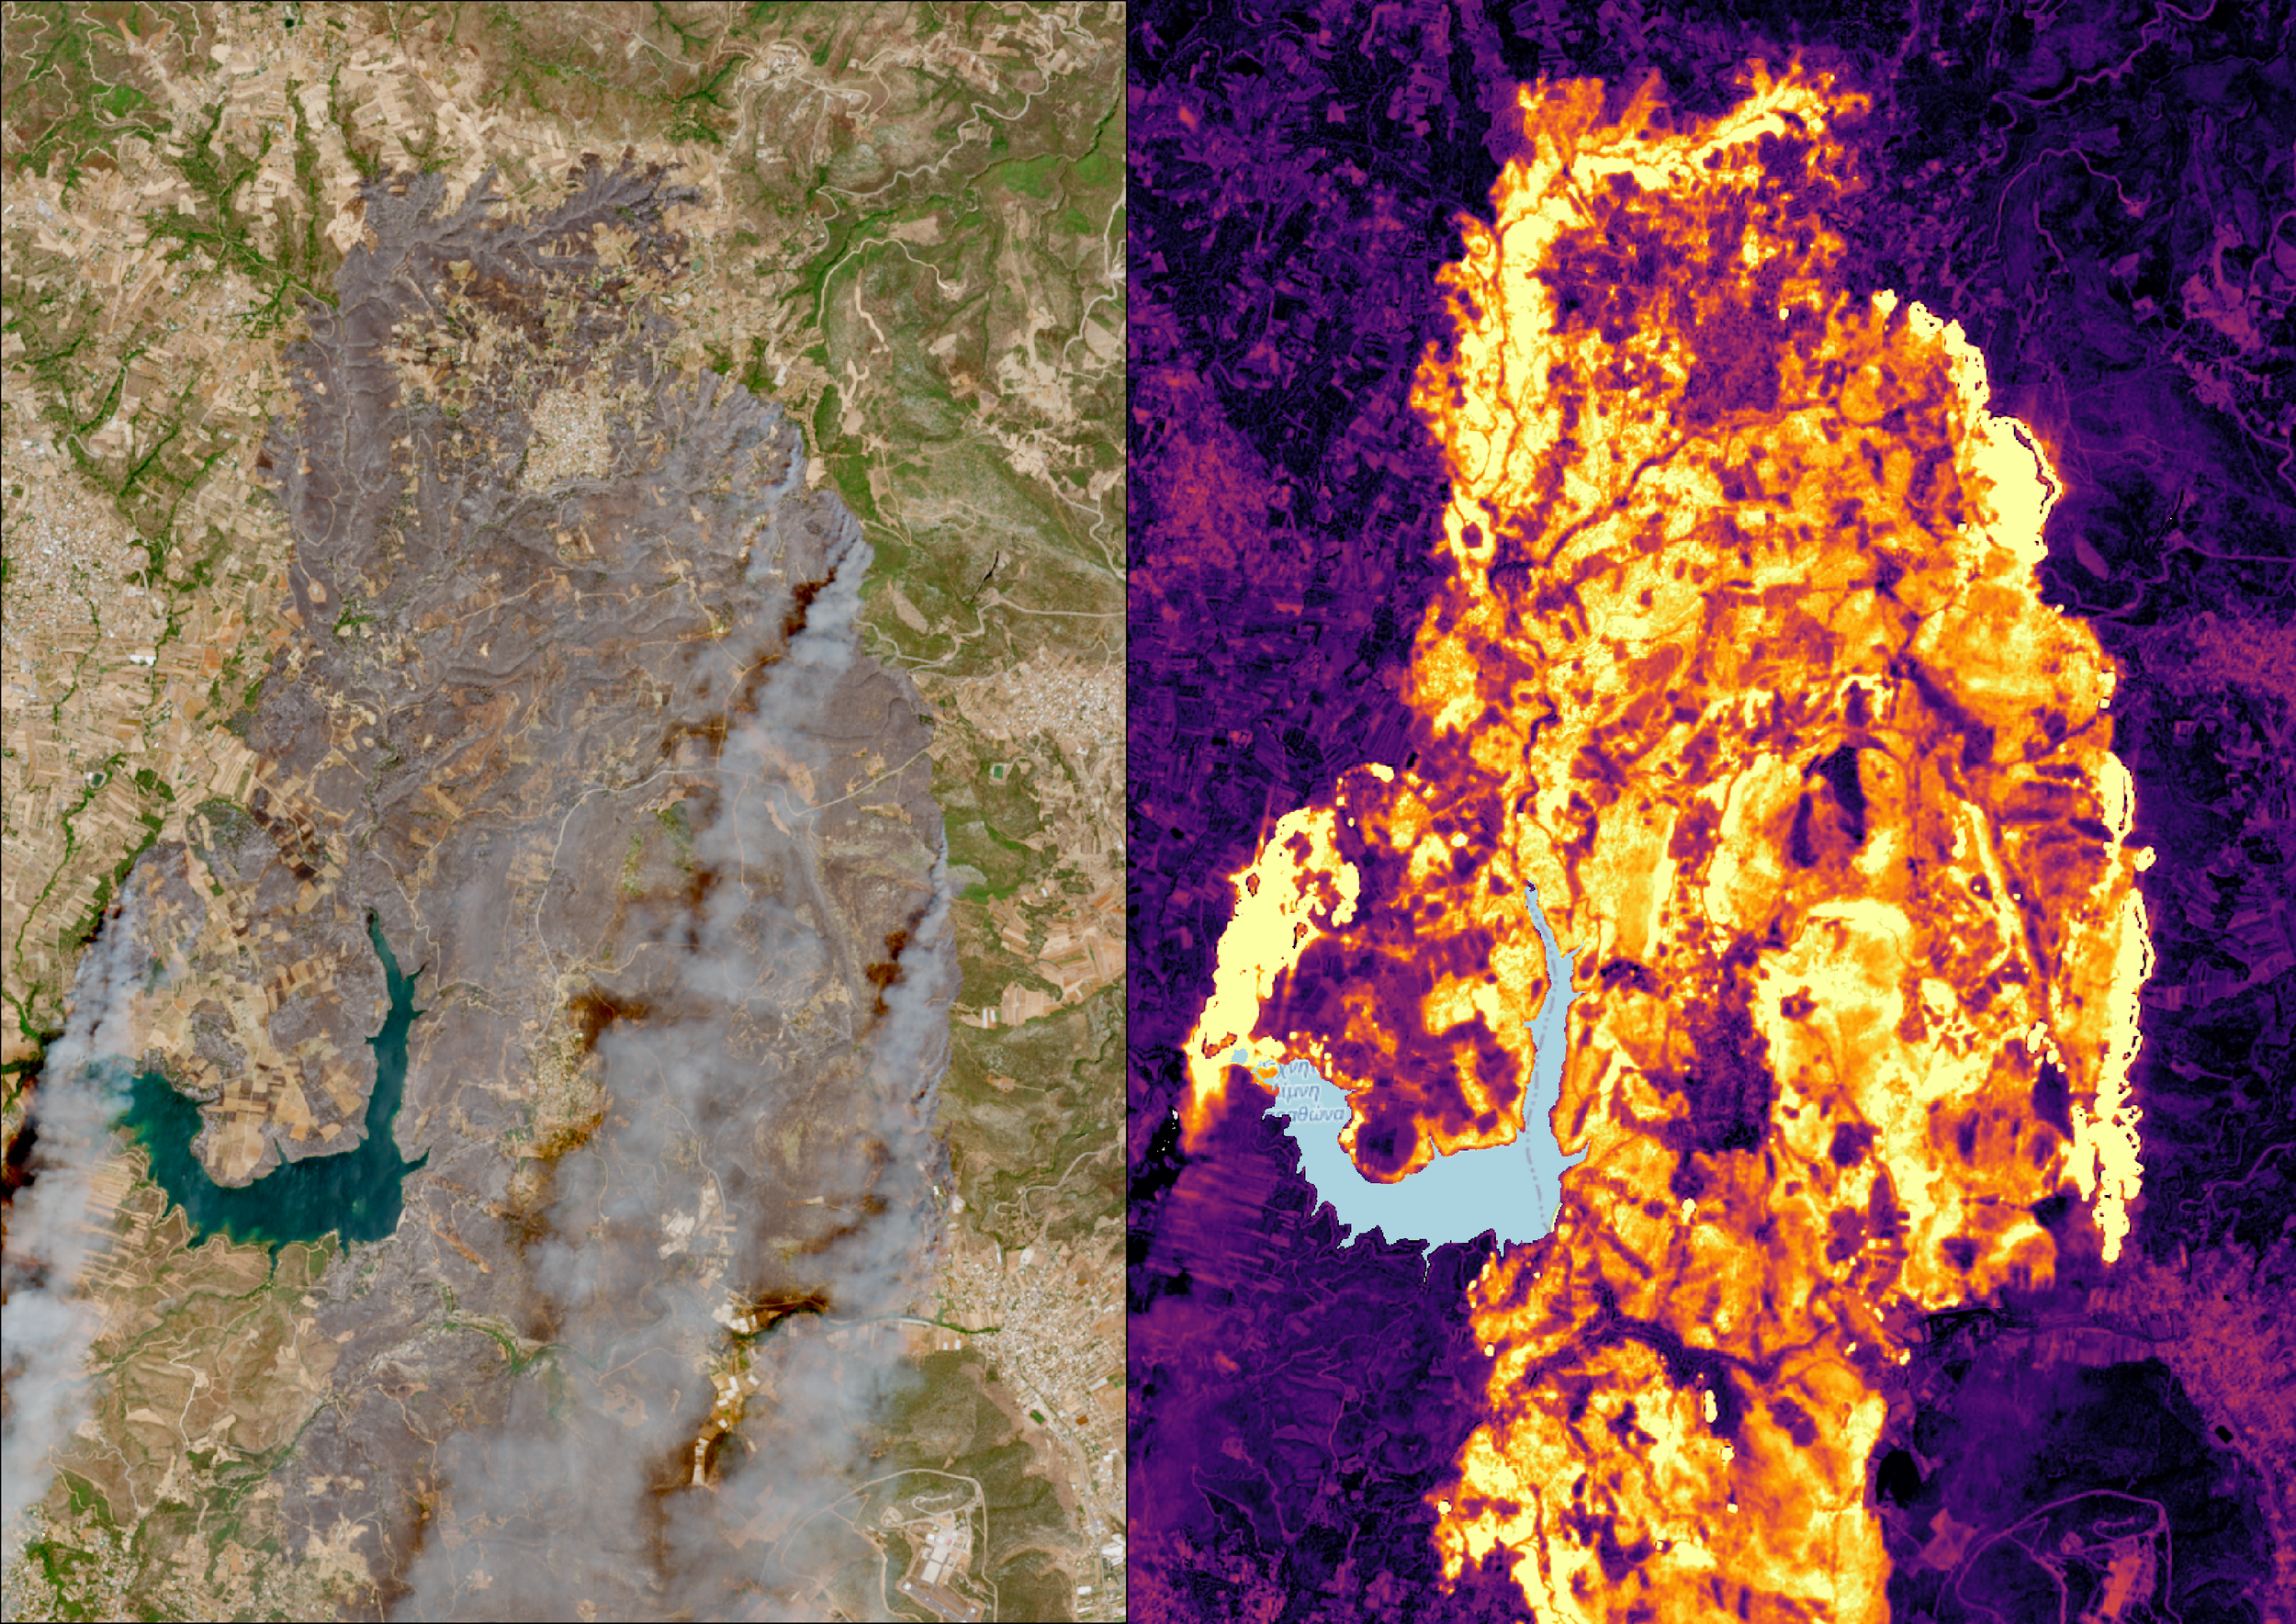 Image 4 of 7
 Image 5 of 7
 Image 6 of 7
 Image 7 of 7