
Why Use Travel Time Instead of a Radius?
A radius counts people who cannot easily reach the store, such as homes across a railway, river or ring road, and treats every direction as equal. A travel-time catchment, or isochrone, follows the street and path network, so it shows who can get to the store within a set number of minutes on foot or by car.
The difference is large. In the Bozmaps example run for a supermarket in Radford, Nottingham, about 2,400 people live within a 5-minute walk and about 160,000 within a 5-minute drive. A shop that serves people on foot and one that serves drivers have very different catchments, even on the same site.
- Walking at 4.8 km/h along streets and paths.
- Driving at the speed limit, which means free-flowing traffic: real journeys at busy times take longer.
- Times measured towards the store, the way customers travel.
- No public transport, and no time spent parking.
Which Walk and Drive Times Should You Use?
Use several bands, not one. Nested walks of 5, 10 and 15 minutes show how quickly the population builds up on foot, and drives of 5, 10 and 15 minutes do the same for trade by car. Pick the bands that match how far people travel for what the store sells, and keep them fixed when you compare sites.
- Run the drive times twice, once free-flowing and once slowed for busy hours, and report both.
- Look at where the people sit: a catchment whose population is mostly in the outer band depends on customers making the longer trip.
- Check the shape on a map. A catchment that stops short at a railway or a dual carriageway tells you where the barriers are.
How Do You Count the People Inside a Catchment?
Use Census 2021 output areas and count each one whose population-weighted centre falls inside the catchment, a best-fit method. That counts the people who live there, rather than slicing areas by land, and gives residents, households, age, car availability and occupation, all as at Census day, 21 March 2021.
- Residents only: workers, students living away from home, visitors and passing trade are not counted.
- The figures describe March 2021, so homes built since then are missing.
- For occupation, the share of residents aged 16 and over in managerial or professional jobs is a simple, comparable measure.
What Does Car Availability Tell a Retailer?
It shows how customers are likely to arrive. Census 2021 table TS045 gives the share of households with no car or van, one, two, or three or more. Where many households have no car, the walking catchment matters more and a large car park matters less; where most have a car, drive time sets the reach.
In the three example runs, the share of households with no car in the 10-minute drive area was 31% around the Nottingham supermarket, 27% around the Leicester bakery and 23% around the Derby pharmacy.
How Do You Estimate Spending Power From Open Data?
Use the ONS gross disposable household income (GDHI) per head for each council in the catchment, weighted by where its residents live. GDHI is the money households have for spending or saving after taxes and benefits. The edition released on 19 August 2026 covers 1997 to 2024, with the 2024 figures provisional.
- The UK average for 2024 was £25,965 per head.
- It is a council-wide average per person, children and retired people included: not the income of a street, a household or a customer.
- It is income, not spending in shops, so read it alongside what the store sells.
- ONS has also published a separate article with small-area estimates, labelled official statistics in development.
How Complete Is OpenStreetMap for Competing Shops?
Useful, but never certain. OpenStreetMap is built by a community of mappers who check it with aerial imagery, GPS and field maps. Some shops are missing, some have closed and some are tagged as a different type, so treat a count of competitors as a starting list to check, not a census of every shop.
- Count by the same tag as your store, such as supermarket, bakery or pharmacy, and look at related tags such as convenience shops.
- Walk or drive the main streets of the catchment to confirm the list.
- Distance to the nearest competitor is usually measured in a straight line; the journey is longer.
- OpenStreetMap data must be credited to OpenStreetMap and its contributors wherever you show it.
What Did the Three Example Catchments Show?
Three Bozmaps example runs made on 8 November 2026, for a supermarket in Nottingham, a bakery in Leicester and a pharmacy in Derby, show how the measures work together. Each used 5, 10 and 15-minute walks and 5 and 10-minute drives, with the same Census, income and OpenStreetMap data.
| Measure | Supermarket, Radford, Nottingham | Bakery, Wycliffe, Leicester | Pharmacy, Arboretum, Derby |
|---|---|---|---|
| People within a 5-minute walk | 2,393 | 3,778 | 2,327 |
| People within a 15-minute walk | 17,771 | 37,334 | 18,819 |
| People within a 10-minute drive | 524,185 | 515,437 | 313,293 |
| Households with no car, 10-minute drive | 31% | 27% | 23% |
| Disposable income per head, 10-minute drive | £20,432 (79% of UK) | £18,615 (72% of UK) | £20,271 (78% of UK) |
| Same-type shops within a 15-minute walk | 2 | 3 | 9 |
| Same-type shops within a 10-minute drive | 83 | 22 | 58 |
| Nearest same-type shop, straight line | 325 m | 483 m | 229 m |
Read together: the Leicester bakery has about twice as many people within a 15-minute walk as the other two and no other bakery within 5 minutes, so walk-in trade matters most. The Derby pharmacy has nine other pharmacies within a 15-minute walk, so its catchment is shared. The Nottingham supermarket has over half a million people within a 10-minute drive, and 83 other supermarkets.
See each map and full report: the supermarket, the bakery and the pharmacy.
What Can a Catchment Report Not Tell You?
It describes who lives within reach, not who will shop. Footfall, workers and visitors, the store's size and range, parking, prices and the strength of nearby rivals all decide trade, and none of them is in the open data used here. Use the catchment to compare sites and to set questions for a site visit.
- Count footfall at the times that matter to the store.
- Check access, parking and deliveries on the ground.
- Ask a commercial agent about rents, vacant units and planned schemes nearby.
- Treat income as an indicator, never as a sales forecast.
How Does the Bozmaps Store Catchment Report Work?
The Bozmaps store catchment report builds walk and drive catchments towards a store on the OpenStreetMap network, counts Census 2021 residents, households, car availability and occupations inside each, weights ONS household income by where residents live, and counts shops of the same type. It gives a map and a report naming every source.
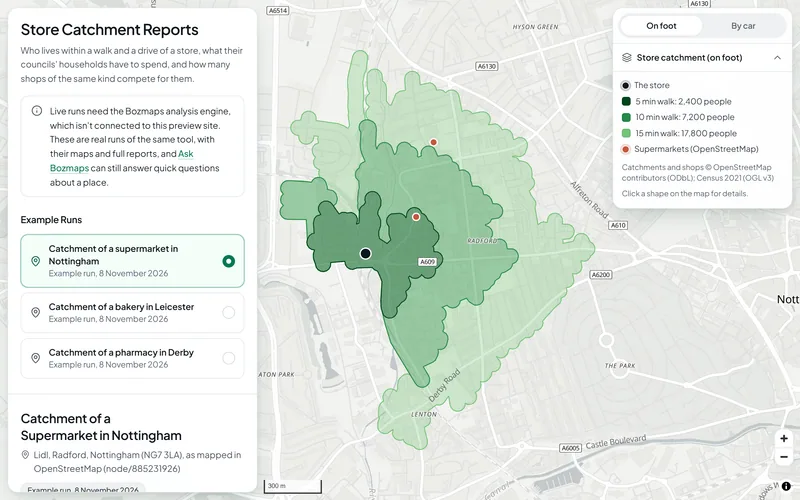
Each run takes up to three walk times and three drive times, from 5, 10, 15 and 20 minutes, a speed factor for traffic (1 for free-flowing, about 0.6 for busy times), and the type of shop to count as competition, from 28 types.
On this site the retail page shows the three real example runs. New runs need the Bozmaps engine, so we run them for you: request a site report. For the wider picture of an area, see crime, deprivation and house prices around a postcode.
Sources
- Census 2021, Nomis (Office for National Statistics)
- TS045: Car or van availability, Nomis (Office for National Statistics)
- Regional gross disposable household income: local authorities, Office for National Statistics, 19 August 2026
- Regional gross disposable household income, UK: 1997 to 2024, Office for National Statistics, 19 August 2026
- About OpenStreetMap, OpenStreetMap
This guide is general information, not professional advice. Check anything you rely on with the source, and with a surveyor, solicitor or consultant where it matters.