
Where to Put New Public EV Chargers
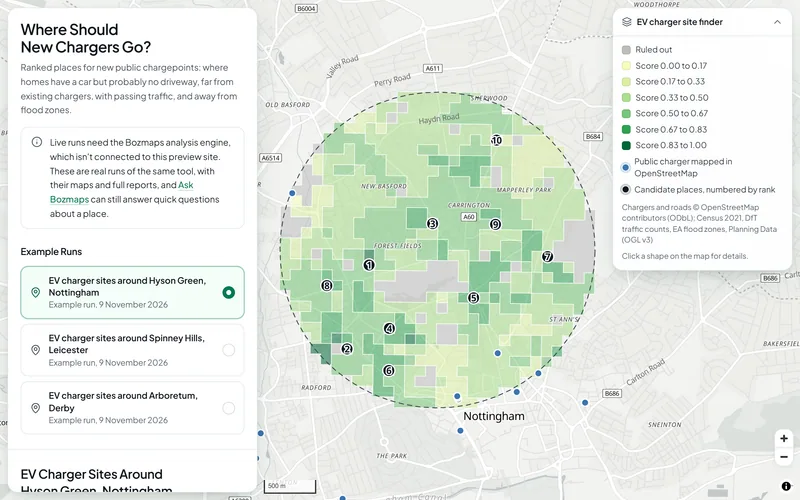
Find where new public chargepoints would serve homes that have a car but probably no driveway, away from existing chargers and flood zones, with passing traffic. The public site shows real example runs for Nottingham, Leicester and Derby; we run new areas for you on request.
The Questions It Answers
Where Do Drivers Have Nowhere to Charge at Home?
No open dataset records off-street parking for each home, so the finder uses Census 2021 households with a car living in flats as the main sign of homes without a driveway, and terraced homes as a second, weaker one.
Where Are the Gaps Between Chargers?
The distance from each place to the nearest public charger mapped in OpenStreetMap, with the Department for Transport's official count of public chargers for the council shown alongside, per 100,000 people.
Which Places Can Take a Charger?
Land more than 60 m from a public road, in flood zone 3 or inside protected nature and heritage sites is ruled out. The rest is scored on demand, the gap to the nearest charger, passing traffic from Department for Transport counts and deprivation, and the ranking is tested by varying each weight.
What You Can Do
How It Works
1.Choose the Area and the Weights
A town centre, a neighbourhood or a point with a search distance (1,500 m in the examples), and how much each criterion matters to you. Send it through the contact form.
2.We Score and Rank
The area is cut into 100 m cells, unsuitable land is ruled out, the rest is scored and the best places are listed at least 400 m apart, with how often each stays in the top three when the weights change.
3.Check the Shortlist on the Ground
Take the ranked places to the network operator, the highway authority and a site visit. The finder says where to look, not whether a charger can go in.
EV Charger Sites Around Hyson Green, Nottingham
In an example run on 9 November 2026, 708 cells of 100 m covered the area within 1,500 m of NG7 6LB and 77 were ruled out, mostly for having no public road within 60 m. OpenStreetMap showed 5 public charging stations in the area; the Department for Transport counted 511 public chargers across Nottingham (154 per 100,000 people, 1 July 2026). The best place, on or near Burford Road, scored 0.90 out of 1 and stayed in the top three in all 500 runs with each weight varied by up to 20%. Nature and heritage designations were not checked in this run, because the national Planning Data service was not answering.
See this exampleThe Data Behind It
Office for National Statistics (via Nomis) · Open Government Licence v3.0
Department for Transport · Open Government Licence v3.0
Public charging devices by local authority
Department for Transport · Open Government Licence v3.0
OpenStreetMap contributors · Open Database Licence 1.0
English Indices of Deprivation 2025
Ministry of Housing, Communities and Local Government · Open Government Licence v3.0
Flood Map for Planning (flood zones)
Environment Agency · Open Government Licence v3.0
Planning Data platform (MHCLG) · Open Government Licence v3.0
| Data | Published by | Licence |
|---|---|---|
| Census 2021 tables | Office for National Statistics (via Nomis) | Open Government Licence v3.0 |
| Road traffic counts (AADF) | Department for Transport | Open Government Licence v3.0 |
| Public charging devices by local authority | Department for Transport | Open Government Licence v3.0 |
| Roads, chargers and car parks | OpenStreetMap contributors | Open Database Licence 1.0 |
| English Indices of Deprivation 2025 | Ministry of Housing, Communities and Local Government | Open Government Licence v3.0 |
| Flood Map for Planning (flood zones) | Environment Agency | Open Government Licence v3.0 |
| Planning designations | Planning Data platform (MHCLG) | Open Government Licence v3.0 |
Every dataset and its credit line is on data sources and licences.
What It Can't Tell You
- A screening of where to look, not a site survey: electricity network capacity, kerb space, parking rules, pavement width, land ownership and planning consent are not checked.
- Existing chargers are those mapped in OpenStreetMap, which usually misses some; there has been no free national list of chargepoint locations since the National Chargepoint Registry closed in November 2024. The council's official total from the Department for Transport is shown alongside.
- Traffic counts cover major roads every year but minor roads only at sample points, so quiet residential streets mostly score 0 on traffic.
- Census 2021 describes homes and cars in March 2021, and 'no driveway' is estimated from homes that are flats.
- The three example runs did not check nature and heritage designations, because the national Planning Data service was not answering when they were made.
- England only for flood zones, designations and deprivation; the Census figures also cover Wales.
The tools are in preview: built and tested, not yet signed off as validated. They screen a place from public data and don't replace a survey or professional advice.
Questions
Something else? Ask us.
Why use flats as a sign of no driveway?
Because no open dataset records off-street parking for each home. Census 2021 households with a car living in flats stand for homes without a driveway, and terraced homes are a second, weaker sign. Both describe March 2021.
How complete is the map of existing chargers?
Not complete. Chargers come from OpenStreetMap, which volunteers map and which usually misses some, because there has been no free national list of chargepoint locations since the National Chargepoint Registry closed in November 2024. The Department for Transport's official total for the council is shown alongside, so you can see the gap.
Can I change the weights?
Yes, when we run it for you: each criterion takes a weight from 0 (ignore) to 5, and a public car park nearby can be added as a criterion. You can also choose whether flood zone 2 is ruled out as well as zone 3.
The examples use the default weights: homes with a car but probably no driveway 33%, distance from existing chargers 22%, and households with a car, terraced homes, passing traffic and deprivation 11% each.
Does it check grid capacity?
No. Electricity network capacity, kerb space, parking rules, pavement width, land ownership and planning consent are not checked. Take the shortlist to the network operator and the highway authority.
Why do quiet streets score low on traffic?
Department for Transport counts cover major roads every year but minor roads only at sample points, so most residential streets score 0 on traffic. Each count shows its year, and minor-road counts can be several years old.
Can I run it for my own area?
Not on the public site, which shows example runs for Hyson Green in Nottingham, Spinney Hills in Leicester and Arboretum in Derby. Request a site report and we run it for your area.
Read Next
Tools
- EV charger site finderRanked places for new public EV chargers: homes with a car but probably no driveway, far from existing chargers, with passing traffic, out of flood zones.
- Site finderRule out protected and flood-prone land, score the rest on what matters to you, rank the best sites in an area of England and test how firm the ranking is.
- Who can reach this placeHow many people live within a walk, a bike ride or a drive of a site in England or Wales, from travel-time areas drawn on the real road and path network.
- Area profileCensus 2021 people and homes, deprivation, house prices and recorded crime around a site in England or Wales, compared with the council and the country.
Want These Checks Run for Your Sites?
Send us the addresses or the site outlines. We run the full checks on the Bozmaps engine, and a person reviews every report before it reaches you.