
Flood and Location Risk Screening for Insurers
Screen a single property or a list of up to 200 for flood exposure, the lie of the land and the neighbourhood around it, from the Environment Agency's flood maps and other official open data.
The Questions It Answers
How Exposed Is the Address to Flooding?
The check reads the Environment Agency's flood zones, its 2025 likelihood maps for rivers and the sea and for surface water, and the wet-day and dry-day reservoir flood extents at the address. Our river and sea band starts from the Environment Agency's likelihood with defences and is raised to medium in flood zone 3, which ignores defences; when that happens, the Environment Agency's own figure is shown beside ours.
What Is the Ground Like?
Slope at the address from Environment Agency LiDAR, from level or gentle (under 5%) to very steep (over 20%), and whether the address is low-lying: less than 20% of the ground within 150 m is lower than it.
How Does the Neighbourhood Compare?
Recorded crime within 250 m over the last 12 months from police.uk, and the neighbourhood's crime decile from the English Indices of Deprivation 2025, banded from high to low. Where police.uk is missing months for the police force, the check says which months it covers and gives no band.
What You Can Do
How It Works
1.Enter an Address or Upload a List
One address or postcode in the risk check, or a CSV of up to 200 rows, each with a postcode or coordinates, in portfolio screening. A sample file is there to try.
2.Read the Bands and the Sources
In the risk check, each peril gets a screening band with the rule behind it written out, and every source is named with its publisher, licence and the date it was read. Portfolio screening lists its sources and licences under the table.
3.Export or Escalate
Download the portfolio results as a CSV for your own systems. For a site or a group of sites that needs the full flood and terrain check, request a site report.
A Risk Check of SW1A 2AA
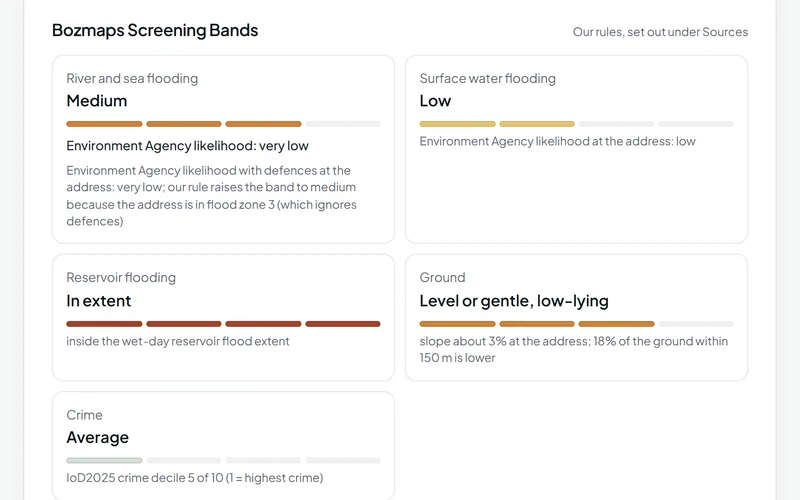
In an example check on 9 November 2026, the Environment Agency's likelihood of river and sea flooding at SW1A 2AA, with defences, was very low, but the address is in flood zone 3, which ignores defences, so our screening band was medium. Surface water likelihood was low, the address was inside the wet-day reservoir flood extent, the ground was level or gentle and low-lying (a slope of about 3%, with 18% of the ground within 150 m lower), and the neighbourhood's crime decile was 5 of 10.
Run this checkThe Data Behind It
Flood Map for Planning (flood zones 2 and 3)
Environment Agency · Open Government Licence v3.0
Risk of flooding from rivers and the sea, and from surface water (2025 national assessment)
Environment Agency · Open Government Licence v3.0
Environment Agency · Open Government Licence v3.0
LiDAR terrain model, 2 m (the full Bozmaps engine reads the 1 m model for one address)
Environment Agency · Open Government Licence v3.0
police.uk (Home Office) · Open Government Licence v3.0
English Indices of Deprivation 2025
Ministry of Housing, Communities and Local Government · Open Government Licence v3.0
| Data | Published by | Licence |
|---|---|---|
| Flood Map for Planning (flood zones 2 and 3) | Environment Agency | Open Government Licence v3.0 |
| Risk of flooding from rivers and the sea, and from surface water (2025 national assessment) | Environment Agency | Open Government Licence v3.0 |
| Reservoir flood extents | Environment Agency | Open Government Licence v3.0 |
| LiDAR terrain model, 2 m (the full Bozmaps engine reads the 1 m model for one address) | Environment Agency | Open Government Licence v3.0 |
| Street-level crime | police.uk (Home Office) | Open Government Licence v3.0 |
| English Indices of Deprivation 2025 | Ministry of Housing, Communities and Local Government | Open Government Licence v3.0 |
Every dataset and its credit line is on data sources and licences.
What It Can't Tell You
- These are screening checks from public maps, not an underwriting model: there is no claims history, building construction or sum insured.
- Flood zones ignore defences; the likelihood maps allow for them. Neither is a property-level flood risk assessment.
- Groundwater and sewer flooding are not covered, nor are ground conditions such as subsidence, shrink-swell clay or mining: only height and slope from LiDAR.
- A postcode is placed at its centre, which can be tens of metres from the building.
- Portfolio screening is lighter than the single check: the wet-day reservoir extent only, crime over the latest 3 months and no ground heights.
- England only for flood, terrain and deprivation; crime covers England and Wales.
The tools are in preview: built and tested, not yet signed off as validated. They screen a place from public data and don't replace a survey or professional advice.
Questions
Something else? Ask us.
Is this an underwriting model or an insurance rating?
No. It is a screening from public maps: there is no claims history, building construction, sum insured or property-level flood model. Use it to see which addresses need a closer look.
Why can your flood band differ from the Environment Agency's?
Because flood zone 3 ignores defences and the likelihood maps allow for them. Our river and sea band starts from the Environment Agency's likelihood with defences and is raised to medium when the address is in flood zone 3 and the likelihood is lower.
Where that happens the check shows the Environment Agency's own figure beside ours, so you see both.
What does 'Not shown at risk' mean?
The address is outside every area in the Environment Agency's likelihood data for rivers and the sea. It is not a guarantee that it will never flood.
How many addresses can I screen at once?
Up to 200 per file in portfolio screening, as a CSV with a postcode or a latitude and longitude in each row. The results come back as a table you can sort and filter to flagged addresses, a map and a CSV.
Why is crime missing for some addresses?
Because police.uk is missing months of data for some police forces. With some months missing, the check says which months the counts cover and gives no yearly figure or band; with every month missing, crime is shown as unavailable.
Which areas are covered?
Flooding, ground and deprivation cover England only. Recorded crime covers England and Wales.
Read Next
Tools
- Property risk checkCheck one address in England for flood zone, flood likelihood, reservoirs, ground slope, crime, deprivation and recent sales, with every source dated.
- Portfolio screeningUpload a CSV of up to 200 addresses and see which are most exposed to flooding, reservoirs and crime, on a sortable table, a map and a CSV to download.
- Flood and terrainHow much of a site in England is in each flood zone and likelihood band, which reservoirs could reach it, and its height, slope and overland flow.
- Area profileCensus 2021 people and homes, deprivation, house prices and recorded crime around a site in England or Wales, compared with the council and the country.
- Planning constraintsSee which of 23 planning and environmental designations cover a site in England or lie near it, and where the council has not published its data.
Guides
- How to Check Flood Risk for a Property in EnglandFlood zones, 2025 national flood risk data, reservoir maps, groundwater and Flood Re: what each shows for a home in England and when to get a specialist.
- Crime, Deprivation and House Prices Around a PostcodeHow to read police.uk crime data, the English Indices of Deprivation 2025, Land Registry Price Paid Data and Census 2021 for the area around a postcode.
Want These Checks Run for Your Sites?
Send us the addresses or the site outlines. We run the full checks on the Bozmaps engine, and a person reviews every report before it reaches you.