
Location Checks for Agents, Developers and Investors
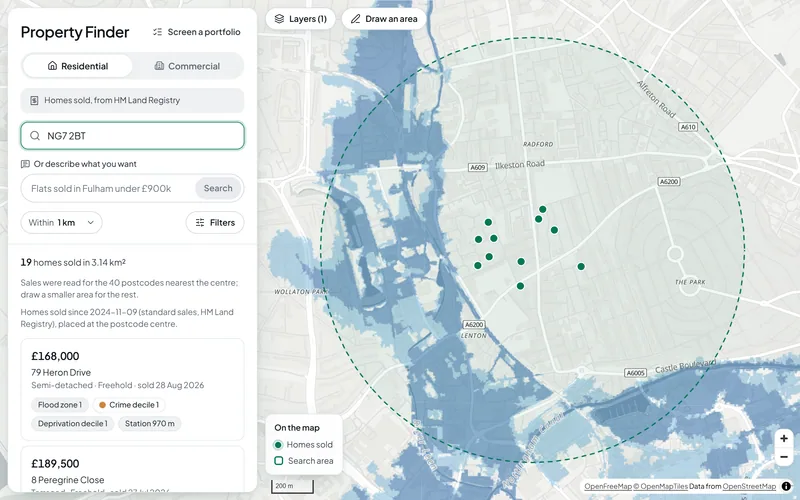
Search a postcode or draw an area and see the homes sold there, each with its flood zone, crime and deprivation, then open any address for a full risk check. For agents, developers, investors and landlords, with the deeper site checks run for you on request.
The Questions It Answers
Is It Exposed to Flooding?
The property risk check reads the Environment Agency's flood zones, its flood likelihood from rivers, the sea and surface water, and the reservoir flood extents at the address. Each gets a screening band with the rule behind it, and the Environment Agency's own figure is shown where our band differs.
What Can Be Built or Changed Here?
The risk check looks for a conservation area, an Article 4 direction, green belt, a tree preservation order area, a listed building within 25 m, a National Park or a National Landscape, and says when the council has not published its data. The full planning constraints check tests 23 national datasets on and around a site.
What Is the Area Like, and What Do Homes Sell For?
Every home sold in the property finder carries its flood zone, crime and deprivation deciles and the distance to a station. The risk check adds recorded crime within 250 m and HM Land Registry sales at the postcode, and the area profile covers a whole neighbourhood: Census 2021 tenure and age, sale prices by type and crime by category.
What You Can Do
How It Works
1.Search a Place
Type a postcode or an address, or draw an area on the map. The property finder lists the homes sold there in the last 24 months, or the commercial premises with an energy certificate.
2.Open an Address
Pick a result, or enter any address in the risk check, for screening bands on flooding, ground and crime, with deprivation, sales, nearby stations and schools and planning designations. Every figure names its source and the date it was read.
3.Go Deeper on a Site
For a purchase, an appraisal or a planning application, request a site report. We run the site checks on the Bozmaps engine and a person reviews the report before it is sent.
Area Profile Around Old Market Square, Nottingham
In an example run on 2 November 2026, Census 2021 counted 23,529 residents within 1,000 m of the square, and 56% of households rented privately or lived rent free, against 29% across Nottingham. From October 2024 to September 2026, 269 standard sales had a median of £166,000 (Nottingham: £200,000), 74% of them flats or maisonettes; a further 286 non-standard sales, such as company purchases and repossessions, were left out of the median.
How the area profile worksThe Data Behind It
HM Land Registry · Open Government Licence v3.0
Energy Performance Certificates (commercial premises and energy ratings)
Ministry of Housing, Communities and Local Government · Open Government Licence v3.0 (address data has separate Royal Mail and OS terms)
Flood Map for Planning (flood zones 2 and 3)
Environment Agency · Open Government Licence v3.0
Risk of flooding from rivers and the sea, and from surface water (2025 national assessment)
Environment Agency · Open Government Licence v3.0
LiDAR terrain model
Environment Agency · Open Government Licence v3.0
Planning Data platform (MHCLG) · Open Government Licence v3.0
police.uk (Home Office) · Open Government Licence v3.0
English Indices of Deprivation 2025
Ministry of Housing, Communities and Local Government · Open Government Licence v3.0
Office for National Statistics (via Nomis) · Open Government Licence v3.0
| Data | Published by | Licence |
|---|---|---|
| Price Paid Data (homes sold) | HM Land Registry | Open Government Licence v3.0 |
| Energy Performance Certificates (commercial premises and energy ratings) | Ministry of Housing, Communities and Local Government | Open Government Licence v3.0 (address data has separate Royal Mail and OS terms) |
| Flood Map for Planning (flood zones 2 and 3) | Environment Agency | Open Government Licence v3.0 |
| Risk of flooding from rivers and the sea, and from surface water (2025 national assessment) | Environment Agency | Open Government Licence v3.0 |
| LiDAR terrain model | Environment Agency | Open Government Licence v3.0 |
| Planning designations | Planning Data platform (MHCLG) | Open Government Licence v3.0 |
| Street-level crime | police.uk (Home Office) | Open Government Licence v3.0 |
| English Indices of Deprivation 2025 | Ministry of Housing, Communities and Local Government | Open Government Licence v3.0 |
| Census 2021 | Office for National Statistics (via Nomis) | Open Government Licence v3.0 |
Every dataset and its credit line is on data sources and licences.
What It Can't Tell You
- A screening from national open data, not a survey, a valuation or a local authority search.
- Homes sold are placed at the centre of their postcode, and a search reads at most the 40 postcodes nearest its centre: draw a smaller area for the rest. HM Land Registry sales don't record bedrooms.
- The finder shows homes sold, not adverts for sale or to rent.
- Commercial premises are those with an Energy Performance Certificate; premises that never needed one are not listed. Rateable values are not shown, because the rating list is not open data.
- Legal title, charges and building condition are not checked. Groundwater, sewer flooding and subsidence are not covered.
- Flooding, ground, deprivation and designations cover England only; the Census, sales and recorded crime also cover Wales.
The tools are in preview: built and tested, not yet signed off as validated. They screen a place from public data and don't replace a survey or professional advice.
Questions
Something else? Ask us.
Can I check one address before a viewing or an offer?
Yes. Enter an address or postcode in England in the property risk check for screening bands on river and sea flooding, surface water, reservoirs, ground and crime, plus deprivation, sales at the postcode, the nearest stations and schools, and planning designations.
Each figure names its source and the date it was read, so you can check it against the official site.
Does the property finder show homes for sale or to rent?
No. It shows homes sold in the last 24 months, from HM Land Registry, anywhere in England and Wales, and commercial premises from the energy certificate register. Each result carries its flood zone, crime and deprivation deciles and the distance to a station, and you can filter on any of them.
Can I screen a whole portfolio or a list of sites?
Yes, up to 200 addresses at a time. Upload a CSV with a postcode or coordinates in each row to portfolio screening and get a table, a map and a CSV back, with flood likelihood, reservoir extents, crime, deprivation and sector sales for each address.
For the full site checks on several sites, request a site report.
What is in a site report?
The site checks that fit your question, from planning constraints, area profile, who can reach the place, site finder, and flood and terrain. Each report gives the answer in plain English, maps, the figures, the method, the limits and every source.
The checks run on the Bozmaps engine, and a person reviews every report before it is sent.
Does this replace a survey or a solicitor's searches?
No. These are screening checks from public maps. They show where to look harder, but they don't replace a survey, a valuation, a flood risk assessment or a local authority search, and they are not professional advice.
Which parts of the UK are covered?
England for every check. In Wales the Census, house sales, recorded crime and the property finder work, but flooding, ground, deprivation and designations are England only. Scotland and Northern Ireland are not covered.
Read Next
Tools
- Property finderSearch homes sold and commercial premises in England and Wales, filter by flood zone, crime and deprivation, and open a risk check on any address.
- Property risk checkCheck one address in England for flood zone, flood likelihood, reservoirs, ground slope, crime, deprivation and recent sales, with every source dated.
- Portfolio screeningUpload a CSV of up to 200 addresses and see which are most exposed to flooding, reservoirs and crime, on a sortable table, a map and a CSV to download.
- Planning constraintsSee which of 23 planning and environmental designations cover a site in England or lie near it, and where the council has not published its data.
- Area profileCensus 2021 people and homes, deprivation, house prices and recorded crime around a site in England or Wales, compared with the council and the country.
- Flood and terrainHow much of a site in England is in each flood zone and likelihood band, which reservoirs could reach it, and its height, slope and overland flow.
- Site finderRule out protected and flood-prone land, score the rest on what matters to you, rank the best sites in an area of England and test how firm the ranking is.
Guides
- How to Check Flood Risk for a Property in EnglandFlood zones, 2025 national flood risk data, reservoir maps, groundwater and Flood Re: what each shows for a home in England and when to get a specialist.
- Planning Constraints to Check Before You Buy Land or a BuildingListed buildings, conservation areas, Article 4, tree orders, green belt, flood zones and nature sites: what each means in England and how to check for it.
- Crime, Deprivation and House Prices Around a PostcodeHow to read police.uk crime data, the English Indices of Deprivation 2025, Land Registry Price Paid Data and Census 2021 for the area around a postcode.
Want These Checks Run for Your Sites?
Send us the addresses or the site outlines. We run the full checks on the Bozmaps engine, and a person reviews every report before it reaches you.