
Area Profile: Who Lives Around a Site
The area profile describes the people and place around a site: Census 2021 population, households, tenure and age, how many residents live in England's most deprived neighbourhoods, what homes sold for over 24 months and how much crime police recorded over 12 months. The Census, deprivation and price figures sit beside the council's, and the Census beside England's too.
What You Give It
- The site: a postcode, an outline drawn on a map, a file, or a travel-time area from Who can reach this place.
- How far around it to profile: 250 m, 500 m, 1 km, 2 km or 5 km. 1 km is the usual distance. A site of 25 ha or more can be profiled inside its outline as drawn.
What You Get
People and Homes
Residents and households, people living in communal establishments such as student halls and care homes, tenure and age bands, each beside the council and England.
Deprivation
The share of residents in England's most deprived 20% and least deprived 20% of neighbourhoods, the spread across all ten deciles, and each of the seven domains, beside the council.
House Prices
Standard sales over the latest 24 months of published data: how many, the median and quartiles, the share of new builds and the median for each type of home, beside the council's median.
Recorded Crime
Crimes recorded over the latest 12 months by type, as a rate per 1,000 residents a year, plus anti-social behaviour incidents.
A Map and a Full Report
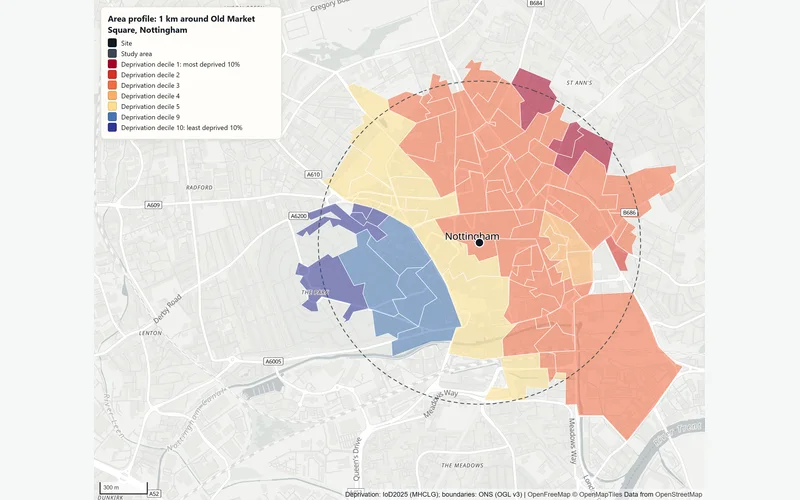
The neighbourhoods shaded by deprivation decile, with the method, limits and sources.
How It Works
Who Counts as Living There
The study area is the site plus the distance you choose. People are counted with the ONS best-fit method: a Census 2021 output area belongs to the study area if its population-weighted centre falls inside it. That counts the people who actually live there, rather than a share of a larger zone by land area.
The Data Behind Each Part
- Census: Census 2021 tables from the Office for National Statistics, read through Nomis, for the study area, the council and England.
- Deprivation: the English Indices of Deprivation 2025 for each small neighbourhood (LSOA), counted by the residents who live in it.
- House prices: HM Land Registry Price Paid Data, each sale placed by its postcode (Ordnance Survey Code-Point Open). Only standard sales count towards the median; purchases by companies, buy-to-let purchases with a mortgage, repossessions and other non-standard sales are counted separately.
- Crime: street-level crime from data.police.uk, with Census 2021 residents as the base for the rate.
1 km Around Old Market Square, Nottingham
In an example run on 2 November 2026 around Old Market Square (NG1 2DT), 23,529 people lived within 1 km, 8,098 of them (34%) in communal establishments such as student halls. 56% of households rented privately, against 29% across Nottingham. 5% of residents lived in England's most deprived 20% of neighbourhoods (Nottingham: 49%), yet on the living environment, crime and health domains 69% to 72% did. 269 standard sales from October 2024 to September 2026 had a median of £166,000 (Nottingham: £200,000). Police recorded 10,675 crimes in the 12 months to August 2026, about 454 per 1,000 residents a year: a city-centre rate.
The Data Behind It
Office for National Statistics, via Nomis · Open Government Licence v3.0
Output area and LSOA boundaries and population-weighted centres
Office for National Statistics · Open Government Licence v3.0
English Indices of Deprivation 2025
Ministry of Housing, Communities and Local Government · Open Government Licence v3.0
HM Land Registry · Open Government Licence v3.0
Code-Point Open
Ordnance Survey · Open Government Licence v3.0
data.police.uk · Open Government Licence v3.0
| Data | Published by | Licence |
|---|---|---|
| Census 2021 tables | Office for National Statistics, via Nomis | Open Government Licence v3.0 |
| Output area and LSOA boundaries and population-weighted centres | Office for National Statistics | Open Government Licence v3.0 |
| English Indices of Deprivation 2025 | Ministry of Housing, Communities and Local Government | Open Government Licence v3.0 |
| Price Paid Data | HM Land Registry | Open Government Licence v3.0 |
| Code-Point Open | Ordnance Survey | Open Government Licence v3.0 |
| Street-level crime | data.police.uk | Open Government Licence v3.0 |
Every dataset and its credit line is on data sources and licences.
What It Can't Tell You
- Deprivation covers England only; the Census, house prices and crime also cover Wales.
- A circle is not a real catchment. For the people within a walk or a drive, profile a travel-time area instead.
- Crime per resident is inflated in town centres, at stations and at retail parks, where most victims and offenders do not live.
- Census 2021 describes March 2021; the numbers have changed since.
- House prices are what sold nearby, not a valuation of any property.
The tools are in preview: built and tested, not yet signed off as validated. They screen a place from public data and don't replace a survey or professional advice.
Questions
Something else? Ask us.
How is the population around a site counted?
With the ONS best-fit method. Census 2021 output areas, the smallest areas the Census publishes, count when the centre of their population falls inside the study area. A study area of 1 km around Old Market Square took in 66 output areas.
Why is the crime rate so high in a town centre?
Because crimes are counted where they happen but divided by the people who live there. A busy centre has many visitors and few residents, so the rate per 1,000 residents runs high.
Which house sales are counted?
Standard sales from HM Land Registry over the latest 24 months of published data. Purchases by companies, buy-to-let purchases with a mortgage, repossessions and other non-standard sales are reported as a separate count and left out of the median, so the median reflects ordinary home sales.
Can I profile a walk or drive catchment instead of a circle?
Yes. A travel-time area from Who can reach this place can be the study area, so the profile describes the people who can walk or drive to the site rather than everyone within a set distance.
Can I run an area profile on the website?
Not on the public site: the profile runs on the Bozmaps analysis engine, which the public site is not connected to. Tell us the site and the distance and we run it for you. For one address, the property risk check runs on the public site and includes deprivation, crime and recent sales.
Read Next
Who Uses It
- PropertyFlood exposure, planning designations, crime, deprivation and recent sales for any address in England, from official open data. For agents and investors.
- Finance and LendingCheck sale prices, flood exposure, crime and deprivation behind a loan, for one property or up to 200, from HM Land Registry and Environment Agency data.
- Planning and DevelopmentPlanning constraints, area profile, travel-time reach, site finder and flood and terrain checks for a site in England, run for you and checked by a person.
- RetailWho lives within a walk or drive of a store, what their councils' households have to spend and how many shops compete, from Census 2021 and OpenStreetMap.
Related Tools
- Who can reach this placeHow many people live within a walk, a bike ride or a drive of a site in England or Wales, from travel-time areas drawn on the real road and path network.
- Property risk checkCheck one address in England for flood zone, flood likelihood, reservoirs, ground slope, crime, deprivation and recent sales, with every source dated.
- Store catchment reportWho lives within a walk and a drive of a store, what their councils' households have to spend, and how many shops of the same kind compete for them.
Want These Checks Run for Your Sites?
Send us the addresses or the site outlines. We run the full checks on the Bozmaps engine, and a person reviews every report before it reaches you.