
What Makes a Good Place for a Public Charger?
A good place has demand that cannot be met at home, few chargers nearby and practical access. For neighbourhood charging that means streets where many households own a car but have no driveway, a gap in existing public chargers, a public road, no serious flood risk and, for faster chargers, passing traffic.
- Demand without a driveway: households with a car living in flats or terraces.
- The gap: distance from the nearest existing public charger.
- Passing traffic: matters most for faster chargers used by visitors and drivers on the move.
- Fair access: deprived neighbourhoods, so the network does not only follow where cars are today.
- Exclusions: land in flood zone 3, land far from a public road, and nature or heritage designations.
Government funding points the same way. The Local Electric Vehicle Infrastructure (LEVI) Fund supports councils in England to plan and deliver charging for residents without off-street parking, and applicants must show that most of the chargepoints will benefit those residents.
How Do You Estimate Homes Without Off-Street Parking?
With proxies. Bozmaps found no open dataset that records off-street parking for each home in England, and the Geospatial Commission noted in 2023 that it is often estimated from proxy datasets. Census 2021 gives good proxies: households with a car living in a flat, and terraced homes, each counted per hectare of their output area.
- RM001, accommodation type by car or van availability: households in a flat, maisonette or similar with one or more cars or vans. This is the strongest sign of demand without a driveway.
- TS044, accommodation type: terraced households, a weaker sign, because some terraces have rear parking or garages.
- TS045, car or van availability: all households with a car, as a general measure of demand.
How Do You Find Existing Public Chargers?
Use two sources together. The Department for Transport's quarterly statistics give the official count of public chargers in each council area, and OpenStreetMap gives mapped locations. On 1 July 2026 the UK had 121,171 public chargers, or 174.9 per 100,000 people, and 28,887 of them were rated 50 kW or more.
- That edition was published on 27 August 2026, and the next is scheduled for November 2026. Since 1 January 2026 the series counts chargers rather than charging devices, so check which measure any older figure uses.
- The statistics are counts by area, not locations. The National Chargepoint Registry, the old government list of locations, was decommissioned on 28 November 2024; operators must now share open data themselves.
- OpenStreetMap shows where chargers are, but volunteers map it, so expect some to be missing. Show the official council total beside any mapped count.
| Area | Public chargers | Per 100,000 people | 50 kW or more |
|---|---|---|---|
| Nottingham | 511 | 154.3 | 166 |
| Leicester | 342 | 88.1 | 101 |
| Derby | 329 | 120.0 | 157 |
| United Kingdom | 121,171 | 174.9 | 28,887 |
How Should Traffic Counts Be Used?
Use them to find passing trade for faster chargers, not to judge overnight demand. The Department for Transport's road traffic statistics give the annual average daily flow at count points: the average number of vehicles passing each day over a full year. The latest estimates, for 2025, were published on 20 May 2026.
- Motorway and A road sections are counted every year or every two, four or eight years, depending on their traffic.
- Minor roads are counted at a sample of sites each year, so most residential streets have no count of their own.
- Each figure is marked as counted or estimated; treat estimated figures with more caution.
- Leave motorways out for neighbourhood charging: drivers cannot stop on them to charge.
How Do You Build Fair Access Into Site Selection?
Add deprivation as a criterion so the list does not simply follow where cars are today. The English Indices of Deprivation 2025 rank every neighbourhood in England, and giving more deprived neighbourhoods a higher score brings streets that a demand-only score would pass over into view. Keep its weight modest and see whether the top sites change.
Weighting is a judgement, so test it. Vary each weight at random many times and keep the places that stay near the top. A site that holds its rank under many sets of weights is a safer recommendation than one that only wins under a single set.
What Did the Three Example Screenings Find?
Three Bozmaps example runs made on 9 November 2026 screened 1,500 m around Hyson Green in Nottingham, Spinney Hills in Leicester and Arboretum in Derby, each split into 708 cells of 100 m. Each gave homes with a car but probably no driveway 33% of the weight, and the gap from existing chargers 22%.
| Measure | Hyson Green, Nottingham | Spinney Hills, Leicester | Arboretum, Derby |
|---|---|---|---|
| Cells ruled out | 77 (11%) | 99 (14%) | 146 (21%) |
| Of which: no public road within 60 m, flood zone 3 | 68, 9 | 76, 23 | 104, 42 |
| Public chargers mapped in OpenStreetMap | 5 | 0 | 10 |
| Top place, on or near | Burford Road | Malabar Road | Warner Street |
| Score out of 1 | 0.90 | 0.85 | 0.82 |
| Nearest mapped charger | 1,000 m | 872 m | 784 m |
| Households with a car in flats, its census area | 34 | 97 | 36 |
| Busiest nearby count point, 2025 | 17,843 a day, A6130 | 29,659 a day, A47 | 13,061 a day, A5250 |
| Stays in the top 3, 500 runs with weights varied by up to 20% | 100% | 100% | 100% |
Spinney Hills shows the clearest gap: no public charger mapped in the search area, the most households with a car in flats at its top place, and the busiest road. Arboretum had the most land ruled out, 42 cells of it in flood zone 3. See the maps and reports for Hyson Green, Spinney Hills and Arboretum.
What Can a Desk Screening Not Check?
It cannot check what only the network operator, the highway authority or a site visit can confirm: whether the local electricity network has capacity, whether the kerb and pavement have room, who owns the land, and whether parking rules allow a charging bay. Treat the ranked list as a shortlist for those checks.
- Grid capacity: a new connection is applied for through the distribution network operator, which reserves the capacity or works out what upgrades are needed, then quotes.
- Traffic regulation orders: a council needs one to designate on-street parking bays for charging. Cross-pavement cable channels usually come without a reserved bay, so they generally do not need one, and whether to allow them is the local authority's decision.
- Kerb space and pavement width: there must be room for the unit and for people walking past.
- Land and consent: ownership, leases and any planning consent the installation needs.
How Does the Bozmaps EV Charger Site Finder Work?
The Bozmaps EV charger site finder splits the area around a place into a grid, 100 m cells within 1,500 m by default. It rules out cells in flood zone 3, inside nature and heritage designations or more than 60 m from a public road, and scores the rest on the criteria above.
- You set a weight from 0 to 5 for each criterion.
- Candidates are the best cells, at least 400 m apart, so the list spreads across the area.
- Each weight is varied at random by up to 20% over 500 runs, and the report says how often each place stays in the top three.
- Each traffic figure shows its year, and the council's official charger count is shown beside the mapped chargers.
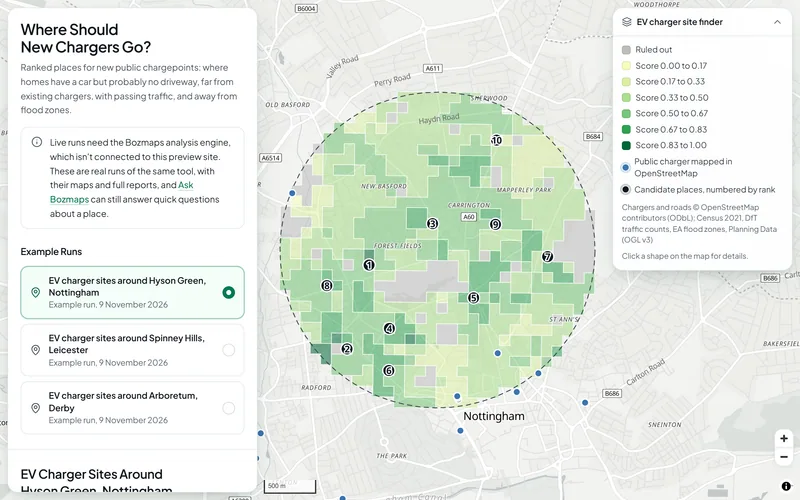
The EV page shows the three real example runs. New runs need the Bozmaps engine, so we run them for you: request a site report.
Sources
- Apply for Local Electric Vehicle Infrastructure (LEVI) funding, Office for Zero Emission Vehicles, 7 September 2023
- Charging Ahead: using location data to boost local EV chargepoint rollout, Geospatial Commission, 30 August 2023
- RM001: Accommodation type by car or van availability by number of usual residents aged 17 years or over in household, Nomis (Office for National Statistics)
- TS044: Accommodation type, Nomis (Office for National Statistics)
- TS045: Car or van availability, Nomis (Office for National Statistics)
- Public electric vehicle charging infrastructure statistics: 1 July 2026, Department for Transport, 27 August 2026
- Electric vehicle charging infrastructure statistics: data tables (EVCI), Department for Transport, 27 August 2026
- Find and use data on public electric vehicle chargepoints (withdrawn), Department for Transport, 2 December 2024
- Road traffic statistics: about the data, Department for Transport
- Road traffic estimates in Great Britain: 2025, Department for Transport, 20 May 2026
- English indices of deprivation 2025, Ministry of Housing, Communities and Local Government, 30 October 2025
- Connecting electric vehicle chargepoints to the electricity network, Department for Energy Security and Net Zero, 3 April 2023
- Cross-pavement solutions for charging electric vehicles, Department for Transport and Office for Zero Emission Vehicles, 4 November 2026
This guide is general information, not professional advice. Check anything you rely on with the source, and with a surveyor, solicitor or consultant where it matters.