
Portfolio Screening for Up to 200 Addresses
Portfolio screening checks a list of up to 200 addresses from a CSV file. Each address gets an overall flood band, its flood zone, surface water likelihood, whether it is inside a reservoir flood extent, a crime level, its deprivation decile, sales in its postcode sector and the nearest station. You get a sortable table, a map and a CSV.
What You Give It
- A CSV file with a header row, up to 200 addresses and under 2 MB. Commas, semicolons and tabs all work as separators.
- In each row, a postcode, a latitude and longitude, or an address with its postcode written in it.
- A reference column if you have one (named ref, reference, id, policy, account or name, for example). It is kept, so the results join back to your own records.
- A sample file with five addresses shows the format.
What You Get
A Summary of What Is Flagged
How many rows were located, and how many have a medium or high flood likelihood, are in flood zone 3, are inside a reservoir flood extent or are in a high-crime neighbourhood.
A Sortable Table
One row per address: the overall flood band, the river and sea band, the flood zone, the surface water band, reservoir, crime level and crimes a year, deprivation decile, sector sales and median price, nearest station, and any problem with the row. Show only the flagged addresses with one switch.
A Map of the Portfolio
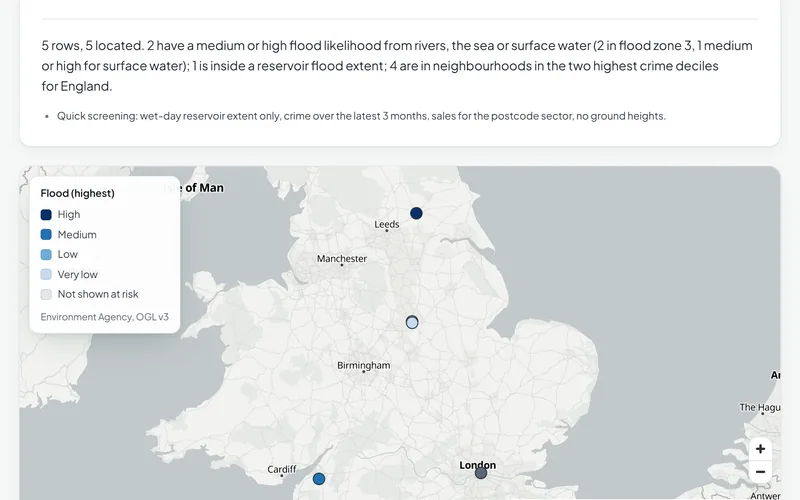
Every located address, coloured by its highest flood likelihood. Choose a row in the table to find it on the map.
A CSV to Download
The same columns as the table, ready to join back to your records. Text that a spreadsheet could run as a formula is written as plain text.
How It Works
The page reads your file and sends the addresses to be checked a few at a time. Each address is placed by its latitude and longitude when the file gives them, otherwise at its postcode centre from the ONS Postcode Directory.
What Each Address Gets
- Flood: the flood zone (Environment Agency Flood Map for Planning, which ignores defences), the Environment Agency's likelihood from rivers and the sea with defences, and its likelihood from surface water. The river and sea band follows the same rule as the property risk check: raised to medium in flood zone 3. The overall band is the higher of the river and sea band and the surface water band.
- Reservoirs: inside the wet-day reservoir flood extent or not.
- Crime: crimes recorded within 250 m over the latest 3 months, as a yearly rate, and the neighbourhood's crime level from its crime decile in the English Indices of Deprivation 2025. High means deciles 1 and 2.
- Deprivation: the neighbourhood's decile in the English Indices of Deprivation 2025, from 1 (most deprived) to 10.
- Sales: the number of standard sales and their median price across the postcode sector, from HM Land Registry sales between 30 September 2024 and 30 September 2026.
- Station: the straight-line distance to the nearest rail station (NaPTAN).
Rows That Cannot Be Checked
No row is dropped. If a postcode is mistyped, new or retired, the coordinates are outside England and Wales, the row has no postcode or coordinates, or a service did not answer, the row stays in the table with the reason in its problem column.
The Five-Address Sample File
In an example screening on 9 November 2026 of the sample file (Old Market Square and the Meadows in Nottingham, King's Staith in York, Tower Hill in London and Bristol harbourside), all 5 addresses were located. 2 had a medium or high flood likelihood from rivers, the sea or surface water: both were in flood zone 3, and 1 of them was medium or high for surface water. 1 was inside a reservoir flood extent and 4 were in neighbourhoods in England's two highest crime deciles.
Screen the sample fileThe Data Behind It
Flood Map for Planning (Rivers and Sea), flood zones 2 and 3
Environment Agency · Open Government Licence v3.0
Risk of flooding from rivers and sea, and from surface water (NaFRA2)
Environment Agency · Open Government Licence v3.0
Reservoir flood extents (wet day)
Environment Agency · Open Government Licence v3.0
data.police.uk (Home Office) · Open Government Licence v3.0
English Indices of Deprivation 2025
Ministry of Housing, Communities and Local Government · Open Government Licence v3.0
HM Land Registry · Open Government Licence v3.0
Postcodes (ONS Postcode Directory via postcodes.io)
Office for National Statistics, Ordnance Survey, Royal Mail · Open Government Licence v3.0
Public transport stops (NaPTAN)
Department for Transport · Open Government Licence v3.0
| Data | Published by | Licence |
|---|---|---|
| Flood Map for Planning (Rivers and Sea), flood zones 2 and 3 | Environment Agency | Open Government Licence v3.0 |
| Risk of flooding from rivers and sea, and from surface water (NaFRA2) | Environment Agency | Open Government Licence v3.0 |
| Reservoir flood extents (wet day) | Environment Agency | Open Government Licence v3.0 |
| Street-level crime | data.police.uk (Home Office) | Open Government Licence v3.0 |
| English Indices of Deprivation 2025 | Ministry of Housing, Communities and Local Government | Open Government Licence v3.0 |
| Price Paid Data | HM Land Registry | Open Government Licence v3.0 |
| Postcodes (ONS Postcode Directory via postcodes.io) | Office for National Statistics, Ordnance Survey, Royal Mail | Open Government Licence v3.0 |
| Public transport stops (NaPTAN) | Department for Transport | Open Government Licence v3.0 |
Every dataset and its credit line is on data sources and licences.
What It Can't Tell You
- Up to 200 addresses in one file; split a longer list into parts.
- A postcode is placed at its centre, which can be tens of metres from the building. Give latitude and longitude for exact points.
- Ground height and slope are not in the public version. Groundwater, sewer flooding and subsidence are not covered at all.
- Crime is left blank where data.police.uk is missing months for the police force, because an incomplete count gives no fair yearly figure or band.
- Not an underwriting or credit model: no claims history, building construction, title, tenure or valuation.
- England only for flood, reservoirs and deprivation; crime, sales and stations also cover Wales.
The tools are in preview: built and tested, not yet signed off as validated. They screen a place from public data and don't replace a survey or professional advice.
Questions
Something else? Ask us.
What does the CSV need?
A header row, then one address per row with a postcode, a latitude and longitude, or an address that includes the postcode. Columns are recognised by common names such as postcode, post_code, latitude, lat, longitude, lon, address and ref. Anything else in the file is ignored.
How many addresses can I screen at once?
Up to 200 rows in one file of under 2 MB. For a longer list, split it into files of 200 and screen each one; the CSVs you download can then be joined on your reference column.
Why does a row show a problem instead of results?
Because it could not be placed or checked: the postcode was not found (mistyped, new or retired), the coordinates are outside England and Wales, the row has no postcode or coordinates, or a data service did not answer. The reason is written in the row, which stays in the table and the download.
How is the overall flood band worked out?
It is the higher of two bands. The river and sea band starts from the Environment Agency's likelihood with defences and is raised to medium in flood zone 3; the surface water band is the Environment Agency's likelihood at the point.
Is it the same as the single-address risk check?
It uses the same flood rule but is lighter, so a list of addresses can be screened in one go: the wet-day reservoir extent only, crime over the latest 3 months, sales for the postcode sector and no ground heights. Run the property risk check on any address the screening flags.
Read Next
Who Uses It
- InsuranceScreen one address or up to 200 for flood zones, flood likelihood, reservoirs, ground and crime, from Environment Agency, police.uk and other open data.
- Finance and LendingCheck sale prices, flood exposure, crime and deprivation behind a loan, for one property or up to 200, from HM Land Registry and Environment Agency data.
- PropertyFlood exposure, planning designations, crime, deprivation and recent sales for any address in England, from official open data. For agents and investors.
Related Tools
- Property risk checkCheck one address in England for flood zone, flood likelihood, reservoirs, ground slope, crime, deprivation and recent sales, with every source dated.
- Property finderSearch homes sold and commercial premises in England and Wales, filter by flood zone, crime and deprivation, and open a risk check on any address.
- Flood and terrainHow much of a site in England is in each flood zone and likelihood band, which reservoirs could reach it, and its height, slope and overland flow.
Want These Checks Run for Your Sites?
Send us the addresses or the site outlines. We run the full checks on the Bozmaps engine, and a person reviews every report before it reaches you.