
Flood and Terrain Screening for a Site
Flood and terrain screens a site outline in England. It measures how much of the site lies in flood zones 2 and 3, in each Environment Agency likelihood band for rivers, the sea and surface water, and inside reservoir flood extents. It reads LiDAR ground heights for height, slope and the land whose rain runs across the site.
What You Give It
- The site as an outline: drawn on a map, a file, or a postcode given a size. A single point is not enough, because the answers are shares of the site's area.
- How far around the site to look: 100 m, 250 m, 500 m or 1 km. 250 m is the usual distance.
What You Get
Flood Zones
The share of the site in flood zone 3 and in flood zone 2, or, for a site wholly in zone 1, the distance to the nearest flood zone 3.
Flood Likelihood
The share of the site in each Environment Agency band (high, medium, low and very low) for rivers and the sea, with defences, and for surface water.
Reservoirs
Every reservoir whose wet-day flood extent reaches the site, by name.
Terrain and Water Flow
Lowest, highest and mean height, the fall across the site, the share in each slope class, which way it faces, the largest area of land draining across it as overland flow, and hollows where water could pond.
Whether a Flood Risk Assessment Is Likely
A line saying a site-specific flood risk assessment would normally be needed when the site is in flood zone 2 or 3, is 1 ha or more, or has medium or high surface water likelihood.
Maps, a Report and the Layers
Maps for rivers and the sea, surface water and terrain, a report, and the flood zones, likelihood areas, reservoir extents and flow paths as a GeoPackage file, with a 2 m height grid.
How It Works
Flooding
- Flood zones: the Environment Agency's current Flood Map for Planning (Rivers and Sea). Zones ignore defences: it is the test used in planning.
- Likelihood: the Environment Agency's 2025 national flood risk assessment (NaFRA2), for rivers and the sea with defences and for surface water. These are published as map services only, so each is drawn for the area with one exact colour per band and read back on a 2 m grid.
- Reservoirs: the Environment Agency's wet-day reservoir flood extents, with each reservoir named.
| Likelihood band | Chance of flooding each year |
|---|---|
| High | 3.3% or more |
| Medium | 1% to 3.3% |
| Low | 0.1% to 1% |
| Very low | Under 0.1% |
Terrain
- Heights: the Environment Agency's LiDAR Composite DTM, a bare-earth model, at 1 m (2 m when the site and its surroundings cover more than 4 km²), averaged to 2 m for slope and flow.
- Slope: Horn's method, in four classes: level or gentle (under 5%), moderate (5 to 10%), steep (10 to 20%) and very steep (over 20%).
- Overland flow: hollows are filled so water always has a way out, each cell drains to its steepest downhill neighbour (the D8 method), and the land upstream is added up cell by cell. Flow paths draining 1 ha or more are drawn, and hollows over 0.1 m deep are reported.
A Site in the Meadows, Nottingham
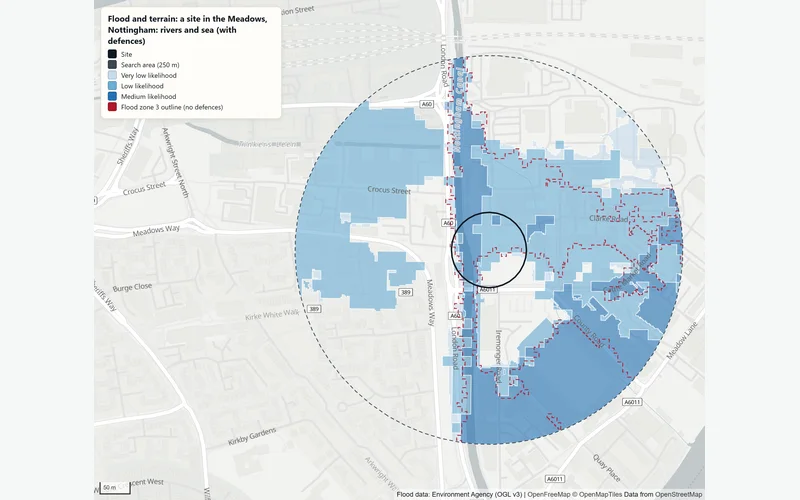
In an example run on 2 November 2026 on a 1.1 ha site in the Meadows, 65% of the site was in flood zone 3 and a further 13% in flood zone 2. With defences, 78% was shown at some risk from rivers, mostly low likelihood (46%) with 28% at medium. 32% was at some risk from surface water, including 10% at high likelihood. Rain falling on about 8.1 ha drains across the site, which lies inside the wet-day flood extent of 14 reservoirs. The ground runs from 23.0 to 26.9 m above sea level. A site-specific flood risk assessment would normally be needed.
The Data Behind It
Flood Map for Planning (Rivers and Sea), flood zones 2 and 3
Environment Agency · Open Government Licence v3.0
Risk of flooding from rivers and sea, and from surface water (NaFRA2)
Environment Agency · Open Government Licence v3.0
Reservoir flood extents (wet day)
Environment Agency · Open Government Licence v3.0
LIDAR Composite DTM, 1 m and 2 m
Environment Agency · Open Government Licence v3.0
| Data | Published by | Licence |
|---|---|---|
| Flood Map for Planning (Rivers and Sea), flood zones 2 and 3 | Environment Agency | Open Government Licence v3.0 |
| Risk of flooding from rivers and sea, and from surface water (NaFRA2) | Environment Agency | Open Government Licence v3.0 |
| Reservoir flood extents (wet day) | Environment Agency | Open Government Licence v3.0 |
| LIDAR Composite DTM, 1 m and 2 m | Environment Agency | Open Government Licence v3.0 |
Every dataset and its credit line is on data sources and licences.
What It Can't Tell You
- A screening, not a site-specific flood risk assessment. Whether an assessment is required is for the planning authority to decide.
- Groundwater and sewer flooding are not covered.
- Flow paths run over bare earth: buildings, walls, kerbs, drains and culverts change real flow paths.
- LiDAR heights can be a few years old, so recent earthworks may not show.
- England only.
The tools are in preview: built and tested, not yet signed off as validated. They screen a place from public data and don't replace a survey or professional advice.
Questions
Something else? Ask us.
What is the difference between flood zones and flood likelihood?
Flood zones ignore defences: zone 3 is land with a 1% or greater chance of flooding from rivers each year, or 0.5% from the sea, if there were no defences. Planning uses them. Flood likelihood allows for defences, so the two can differ where defences exist. The check gives both.
Why can it not run on a postcode alone?
Because the answers are shares of an area: how much of the site is in each zone and band. A postcode is a point, so it needs a size or, better, the real outline. For one address, the property risk check reads the flood maps at a single point.
What does 'rain falling on 8.1 ha drains across the site' mean?
Following the ground downhill, the largest area of land whose rain would run across the site as overland flow is about 8.1 ha. It shows where surface water comes from, before drains and buildings are taken into account.
How is this different from the property risk check?
The property risk check reads one point, for one address, and adds crime, deprivation and sales. Flood and terrain measures a whole site: shares of the area in each zone and band, named reservoirs, slope across the site, overland flow and 1 m LiDAR heights.
Can I run it on the website?
Not on the public site, which is not connected to the Bozmaps analysis engine. Send us the site outline or a postcode with a size and we run it for you.
Read Next
Who Uses It
- Planning and DevelopmentPlanning constraints, area profile, travel-time reach, site finder and flood and terrain checks for a site in England, run for you and checked by a person.
- InsuranceScreen one address or up to 200 for flood zones, flood likelihood, reservoirs, ground and crime, from Environment Agency, police.uk and other open data.
- PropertyFlood exposure, planning designations, crime, deprivation and recent sales for any address in England, from official open data. For agents and investors.
Guides
- How to Check Flood Risk for a Property in EnglandFlood zones, 2025 national flood risk data, reservoir maps, groundwater and Flood Re: what each shows for a home in England and when to get a specialist.
- Planning Constraints to Check Before You Buy Land or a BuildingListed buildings, conservation areas, Article 4, tree orders, green belt, flood zones and nature sites: what each means in England and how to check for it.
Related Tools
- Property risk checkCheck one address in England for flood zone, flood likelihood, reservoirs, ground slope, crime, deprivation and recent sales, with every source dated.
- Planning constraintsSee which of 23 planning and environmental designations cover a site in England or lie near it, and where the council has not published its data.
- Portfolio screeningUpload a CSV of up to 200 addresses and see which are most exposed to flooding, reservoirs and crime, on a sortable table, a map and a CSV to download.
Want These Checks Run for Your Sites?
Send us the addresses or the site outlines. We run the full checks on the Bozmaps engine, and a person reviews every report before it reaches you.