
Rooftop Solar, Roof by Roof
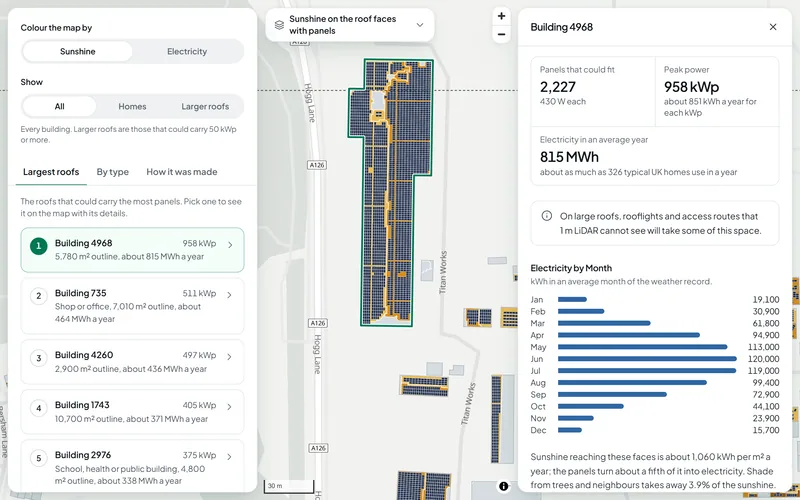
Solar roofs shows solar installers, landlords and councils which roofs in an area of England are worth a closer look. Each roof is split into faces from 1 m LiDAR. Each face gets its sunshine in real weather with the shade from trees and neighbours taken off, then a panel layout, its peak power in kWp and the electricity it could make in each month.
What You Give It
- Nothing on this site: the map covers example areas, ready to explore.
- For your own buildings: a list of addresses, a site outline or an area in England. Send it to us and we make the same map for it.
What You Get
Every Roof Face
Which way each face looks, its pitch and its area, the sunshine it gets as a share of the best possible, and how much of that the shade from trees and neighbours takes away.
The Panels That Could Fit
A panel layout on each face that gets enough sunshine, drawn on the map panel by panel, with the number of panels and the peak power in kWp.
Electricity by Month
The electricity each building could make in an average year and in each month, in kWh, and how that compares with what a typical UK home uses in a year.
The Largest Roofs
A ranked list of the roofs that could carry the most panels, and the totals by type of building: homes, shops and offices, industry and warehouses, and schools, health and public buildings.
Why a Building Has No Panels
Where no panels are counted the map says why: not enough room, too little sunshine, no clear roof face, or a building the LiDAR survey does not show.
Totals for the Area
The buildings with room for panels, their total peak power, the electricity they could make in an average year and the number of typical UK homes that use as much electricity in a year.
How It Works
The map is worked out in five steps, all from open data.
- Roof shape: the Environment Agency's 1 m LiDAR gives the height of the ground and of everything on it. Inside each building outline the roof is split into faces, each pitched or level, with the way it looks, its pitch and its area.
- Shade: the same LiDAR shows the trees and buildings around each roof. Everything within 300 m is used to work out when each face is in shade.
- Sunshine: every hour of 2005 to 2023 from PVGIS, the European Commission's solar data service. Each month is therefore a long-term average of real weather.
- Which faces count: a face counts when it gets at least 70% of the best possible yearly sunshine in the area.
- Panels and electricity: 430 W panels are laid out face by face with clear edges, on 10 degree frames on level roofs. Electricity uses PVGIS's performance ratio with 14% system losses.
Sunshine and Electricity Are Two Different Figures
Sunshine is the energy reaching a roof face, in kWh per m² a year. Electricity is what the panels on it make, in kWh. Panels turn about a fifth of the sunshine that reaches them into electricity, so the map shows both and keeps them apart.
The Data Behind It
LiDAR Composite, 1 m (first return and last return surface models, and the terrain model)
Environment Agency · Open Government Licence v3.0
Building outlines and uses, including OpenStreetMap and Microsoft ML Building Footprints
Overture Maps Foundation · Open Database Licence 1.0
PVGIS solar radiation and PV performance, 2005 to 2023
European Commission, Joint Research Centre · © European Union. Free to reuse with credit (European Commission reuse notice, CC BY 4.0)
| Data | Published by | Licence |
|---|---|---|
| LiDAR Composite, 1 m (first return and last return surface models, and the terrain model) | Environment Agency | Open Government Licence v3.0 |
| Building outlines and uses, including OpenStreetMap and Microsoft ML Building Footprints | Overture Maps Foundation | Open Database Licence 1.0 |
| PVGIS solar radiation and PV performance, 2005 to 2023 | European Commission, Joint Research Centre | © European Union. Free to reuse with credit (European Commission reuse notice, CC BY 4.0) |
Every dataset and its credit line is on data sources and licences.
What It Can't Tell You
- Indicative figures from LiDAR and weather data, an upper bound before a visit: roof strength, wiring, inverter sizing and grid connection are not assessed.
- 1 m LiDAR cannot see chimneys, vents, rooflights or small dormers, or panels already on a roof. On large roofs, rooflights and access routes will take some of the space.
- The LiDAR is from surveys up to 2022. Newer buildings are flagged and left out.
- Trees are treated as solid all year.
- Buildings are shown by their outline and a number, not by address.
- England only for now.
The tools are in preview: built and tested, not yet signed off as validated. They screen a place from public data and don't replace a survey or professional advice.
Questions
Something else? Ask us.
Does it allow for shade?
Yes. Shade from trees and from other buildings within 300 m is worked out from the same 1 m LiDAR, and each building shows the share of its sunshine that shade takes away.
Trees are treated as solid all year, so a tree that loses its leaves still counts as full shade in winter.
Where do the sunshine figures come from?
From PVGIS, the European Commission's solar data service: every hour of 2005 to 2023. The months on the map are long-term averages of real weather, cloud included.
What is the difference between kWp and kWh?
Peak power, in kWp, is what the panels are rated to give in full sun. Electricity, in kWh, is what they make over time in real weather. The map gives peak power for every face and building, and kWh for each month and for an average year.
Why does a building show no panels?
For one of a few reasons, and the map says which: there is not enough room on the faces that get enough sunshine, no face gets enough sunshine, the LiDAR shows no clear roof face, or the building does not show in the LiDAR survey, which can be older than the building.
Can I use the figures to order an installation?
No. They show which roofs are worth a closer look and roughly how much they could carry. Before any installation the roof's strength, the wiring, the inverter and the grid connection have to be checked on site, and small roof features that 1 m LiDAR cannot see will take some of the space.
Can you make this for my buildings or my area?
Yes, for places in England. Send us the addresses, a site outline or the area and we make the same map and figures for it.
Read Next
Related Tools
- Flood and terrainHow much of a site in England is in each flood zone and likelihood band, which reservoirs could reach it, and its height, slope and overland flow.
- Portfolio screeningUpload a CSV of up to 200 addresses and see which are most exposed to flooding, reservoirs and crime, on a sortable table, a map and a CSV to download.
- Site finderRule out protected and flood-prone land, score the rest on what matters to you, rank the best sites in an area of England and test how firm the ranking is.
Want These Checks Run for Your Sites?
Send us the addresses or the site outlines. We run the full checks on the Bozmaps engine, and a person reviews every report before it reaches you.