Blog

Insights & tutorials

Practical guides, case studies, and thought pieces on GIS, remote sensing, and geospatial technology from Bozmaps in Grays, Thurrock, Essex, worked on real places across the UK.

TutorialGuideCase StudyOpinion

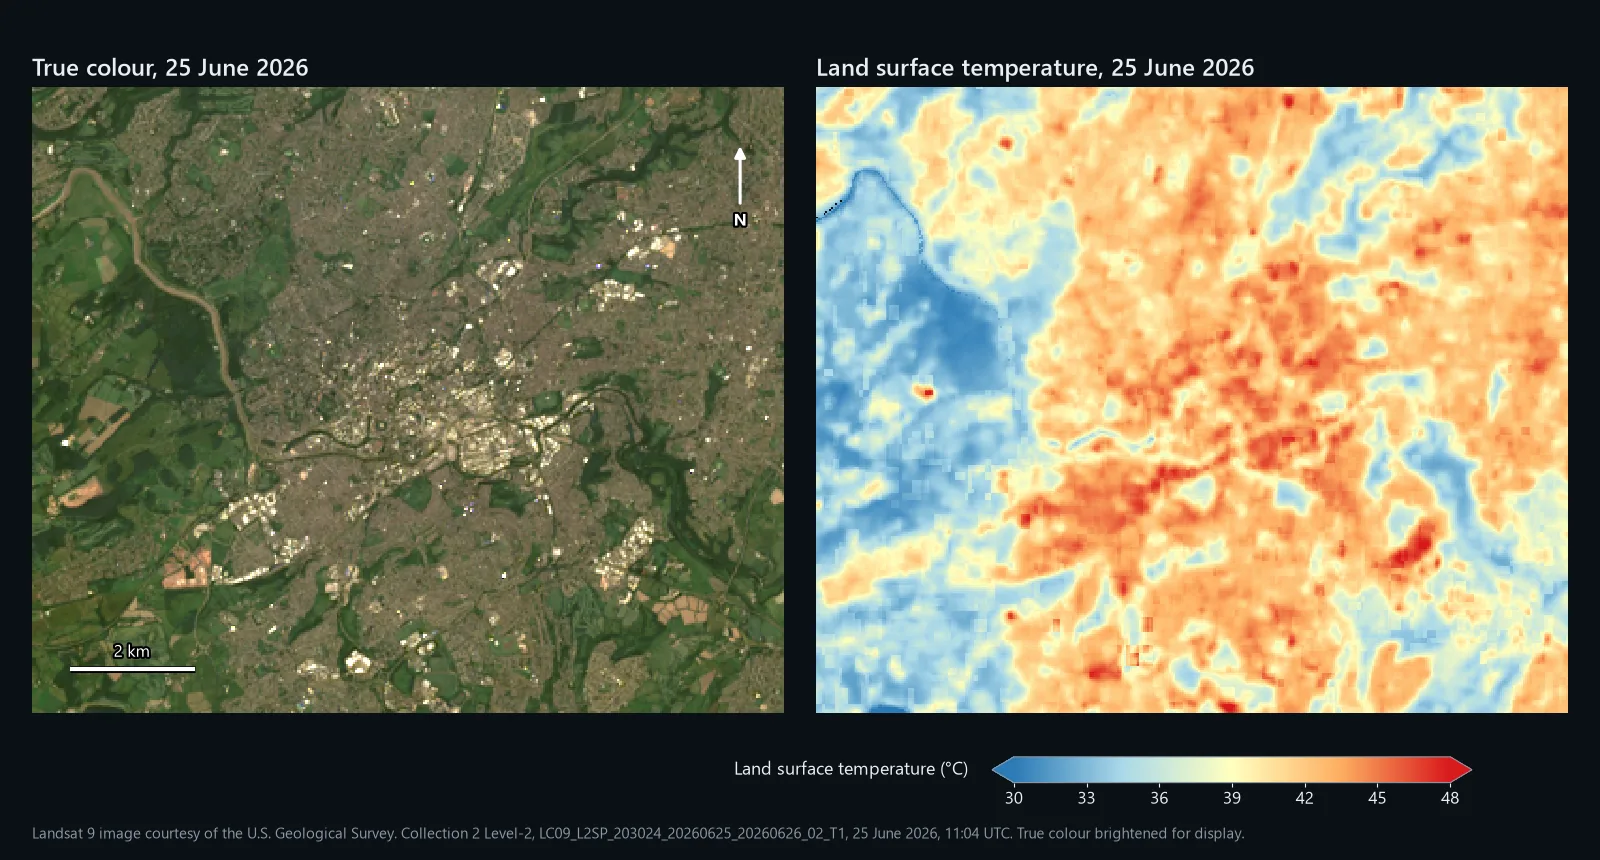
True colour and land surface temperature maps of Bristol from Landsat 9 on 25 June 2026, with the built-up centre and east in orange and red and the woods and fields to the west in blue
Tutorial12 Nov 2026

Land surface temperature in QGIS from Landsat 8 and 9

Land surface temperature in QGIS two ways: the USGS Level-2 product in one Raster Calculator line, and the single-channel method by hand. Run on Bristol on 25 June 2026, where the two came out 8.1 °C apart, and why.

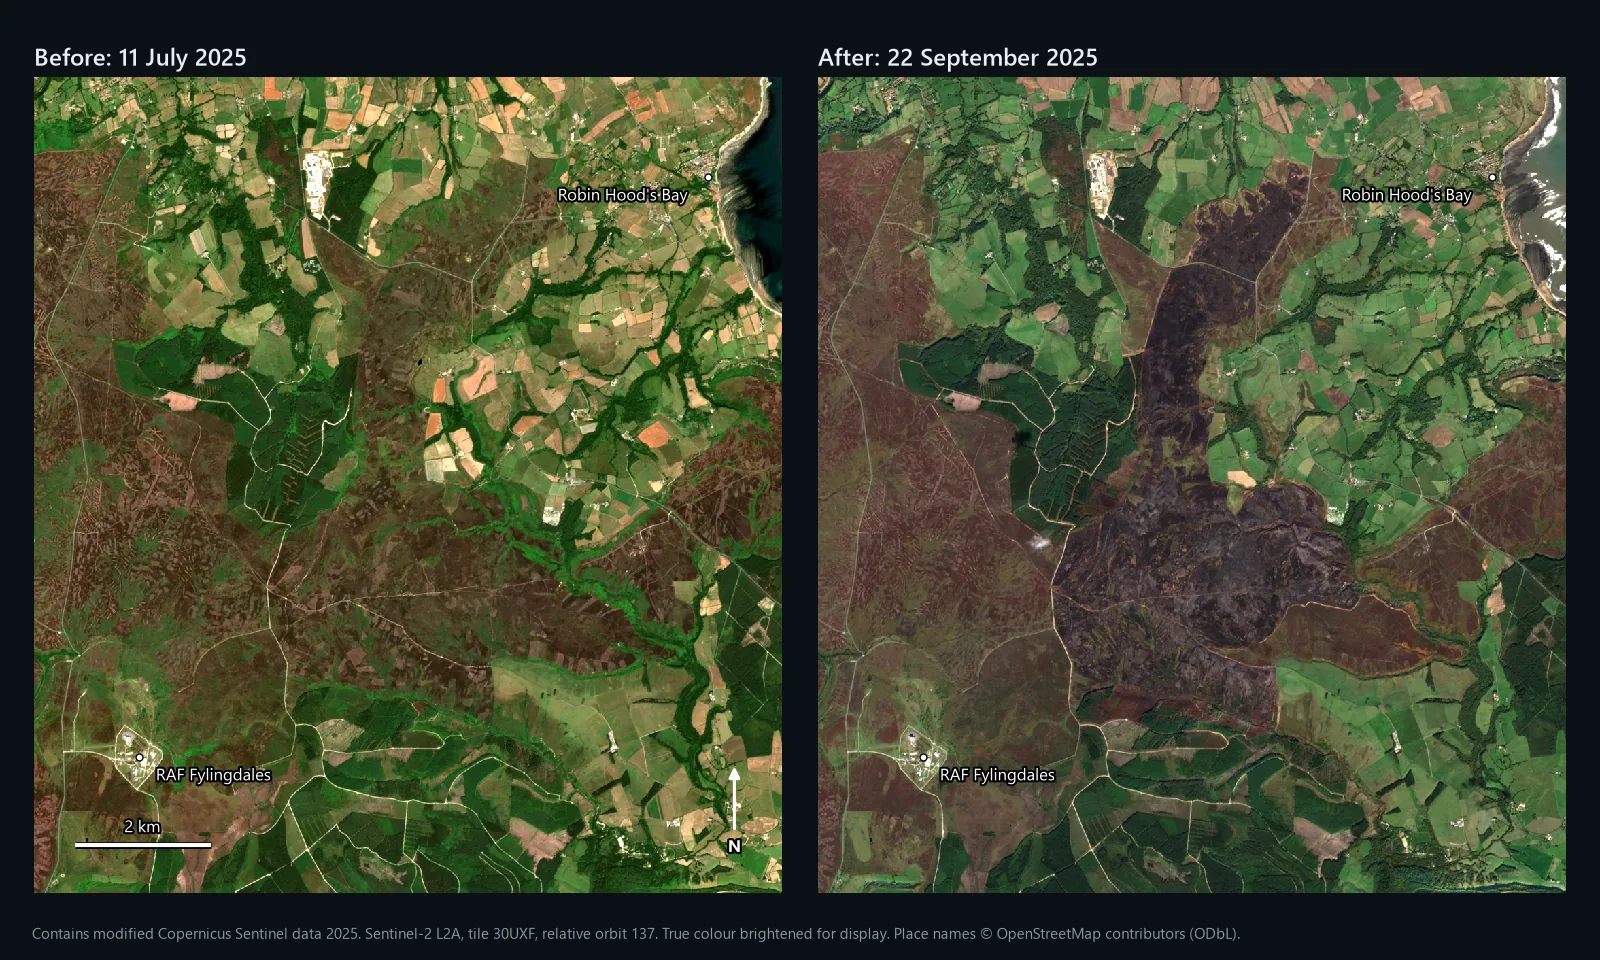
Sentinel-2 true colour images of Fylingdales Moor on the North York Moors on 11 July and 22 September 2025, the second showing a large dark burn scar running north across the moor
Tutorial12 Nov 2026

Wildfire burn severity in QGIS: dNBR from Sentinel-2

dNBR burn severity in QGIS from Sentinel-2, worked on the 2025 Fylingdales Moor fire on the North York Moors: 1,649 ha by our boundary against 1,677 ha from EFFIS, and why a year-earlier pre-fire image added 292 ha.

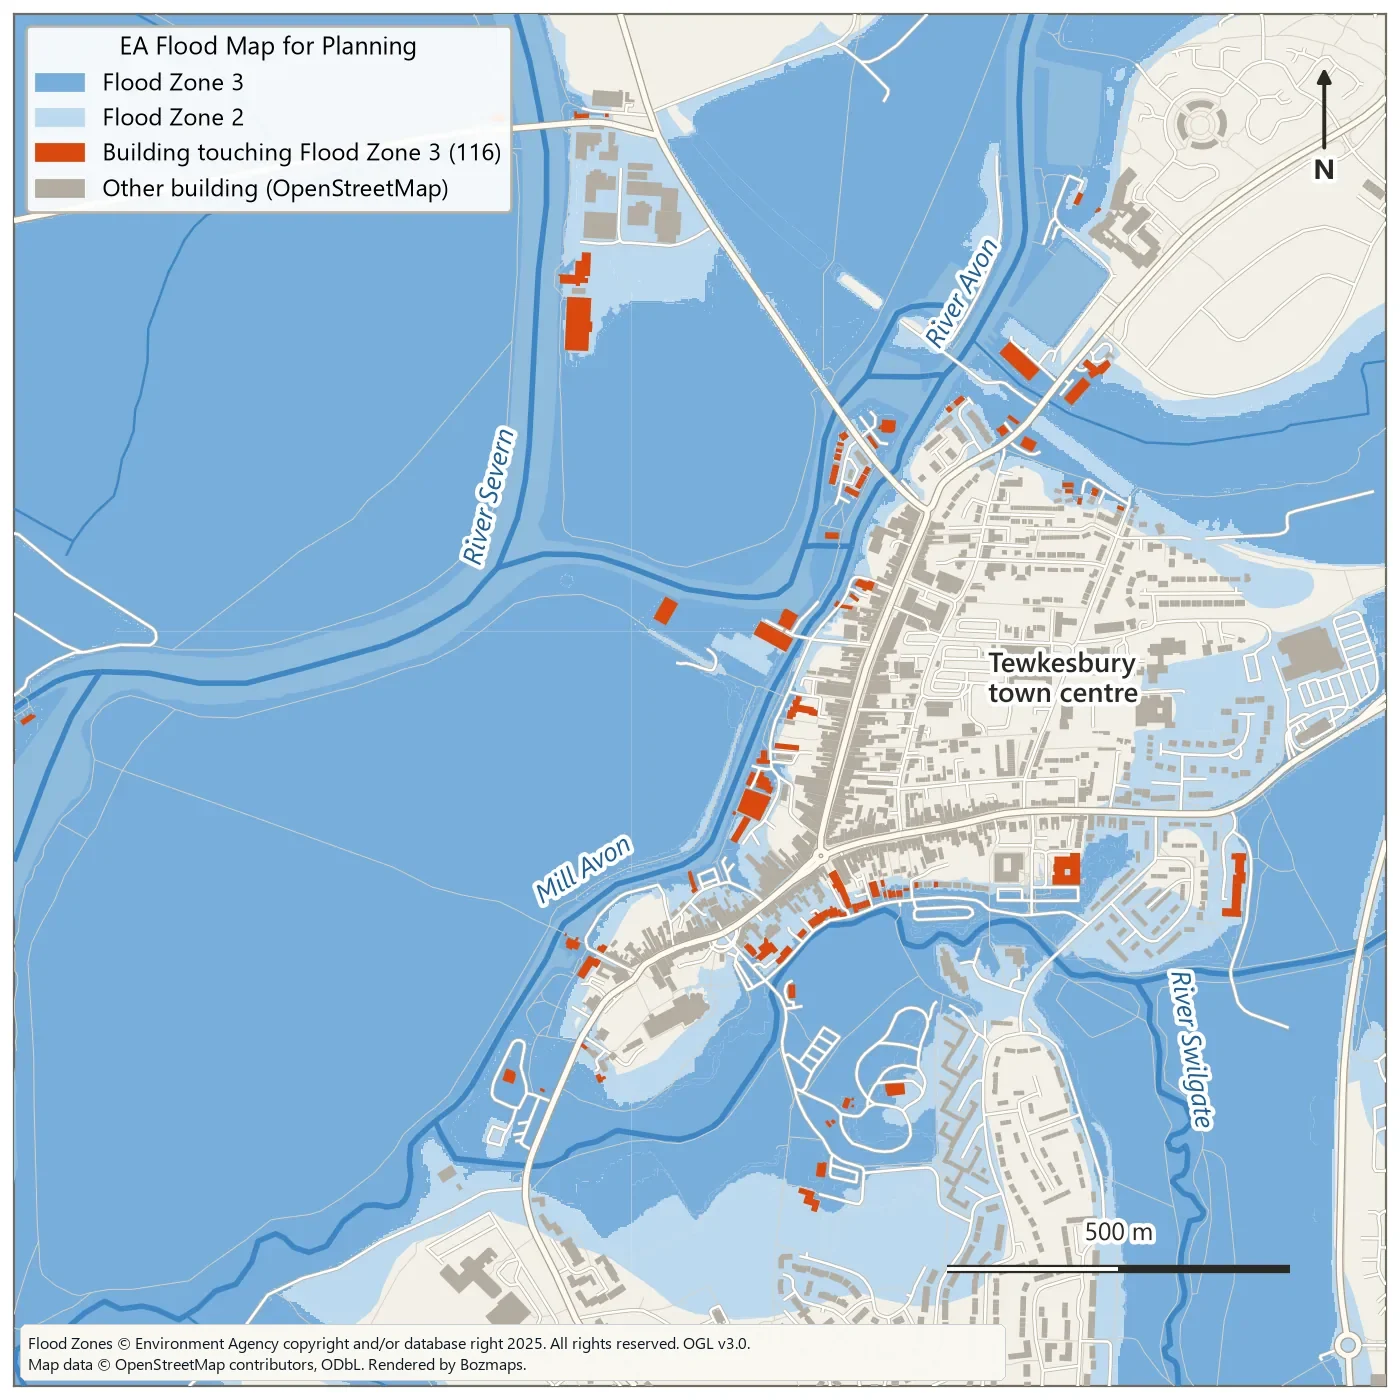
Map of Tewkesbury showing Environment Agency Flood Zones 2 and 3 in blue over OpenStreetMap buildings, with 116 buildings touching Flood Zone 3 highlighted in orange
Tutorial9 Nov 2026

Flood risk mapping in QGIS with the Graphical Modeler

Overlay the Environment Agency flood zones on buildings, map land below a chosen water level from 1 m LiDAR, then turn it into a QGIS model you can rerun. Run live on Tewkesbury, with the real numbers.

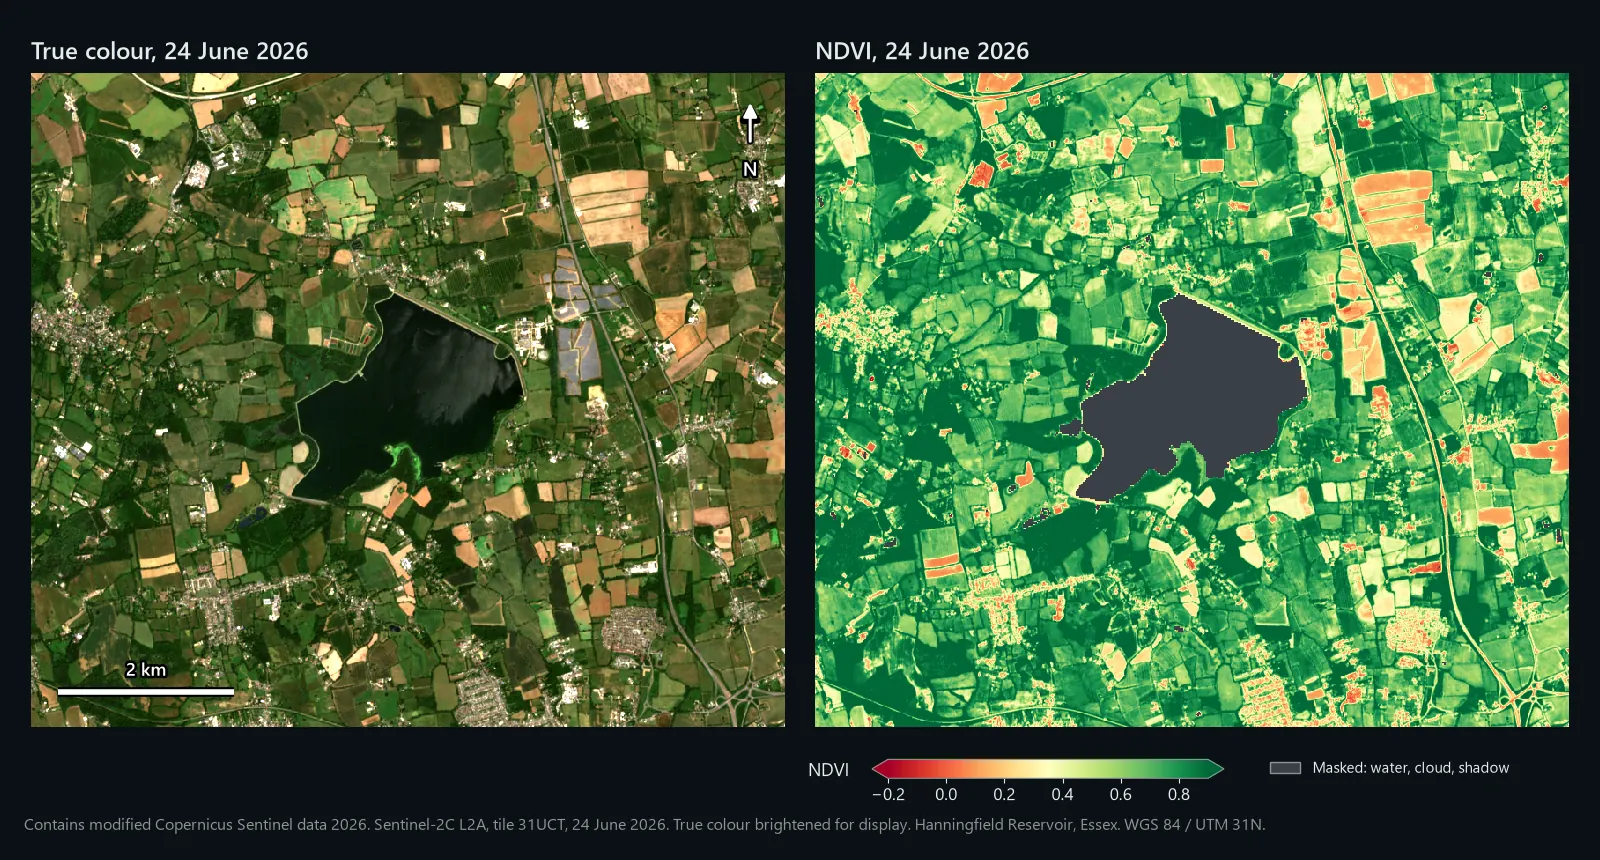
True colour and NDVI maps of farmland around Hanningfield Reservoir, Essex, from Sentinel-2 on 24 June 2026
Guide9 Nov 2026

How to calculate NDVI in QGIS from Sentinel-2, and compare two dates

A practical QGIS 3.44 walkthrough: download Sentinel-2 L2A, handle the -1000 offset, mask clouds with SCL, get per-field NDVI and map change between two dates. Worked on real Essex farmland, June and August 2026.

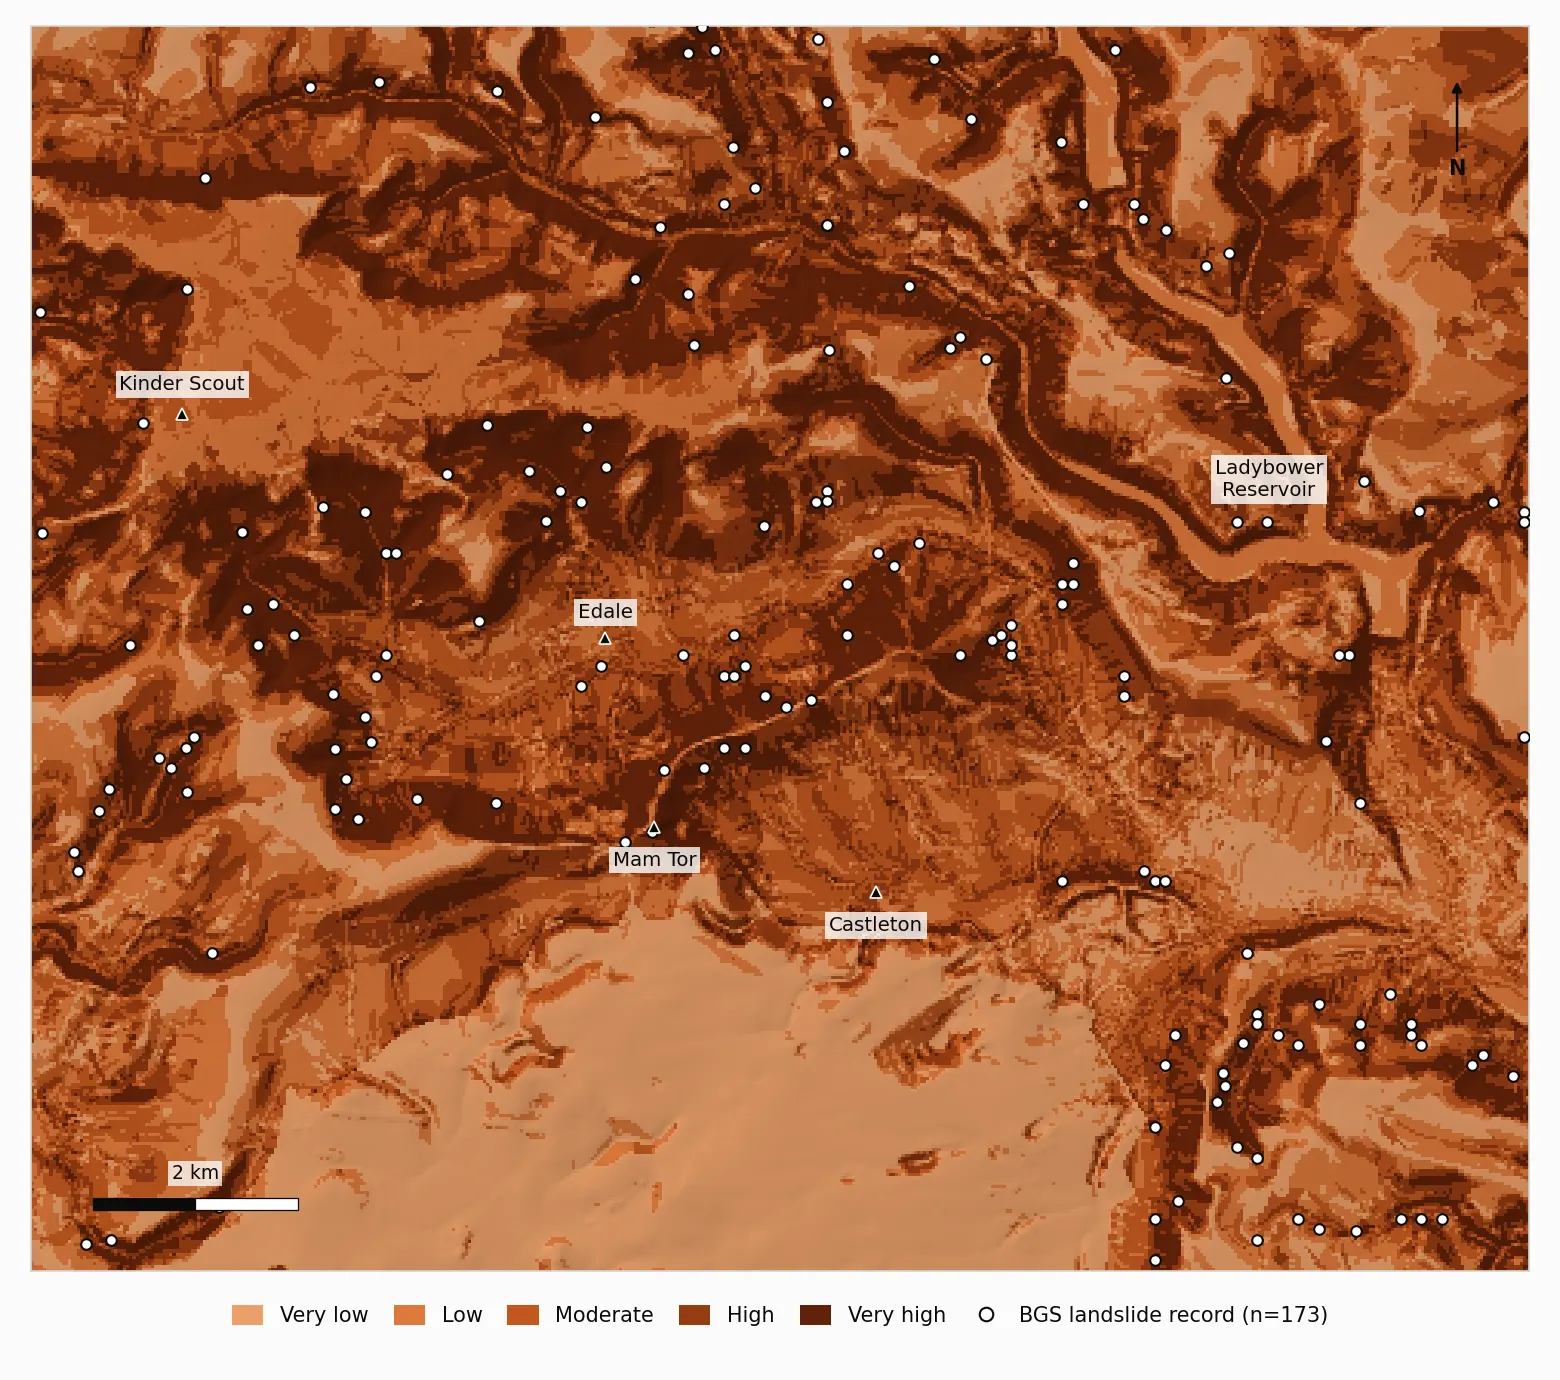
Landslide susceptibility map of Edale and the Hope Valley in five classes, with BGS landslide records
Tutorial9 Nov 2026

Landslide susceptibility mapping in QGIS: a weighted overlay you can check

Slope, geology, curvature, land cover and distance layers, reclassified, weighted with AHP and combined in QGIS, then checked against 173 BGS landslide records in the Peak District. Real run, real figures, AUC 0.79.

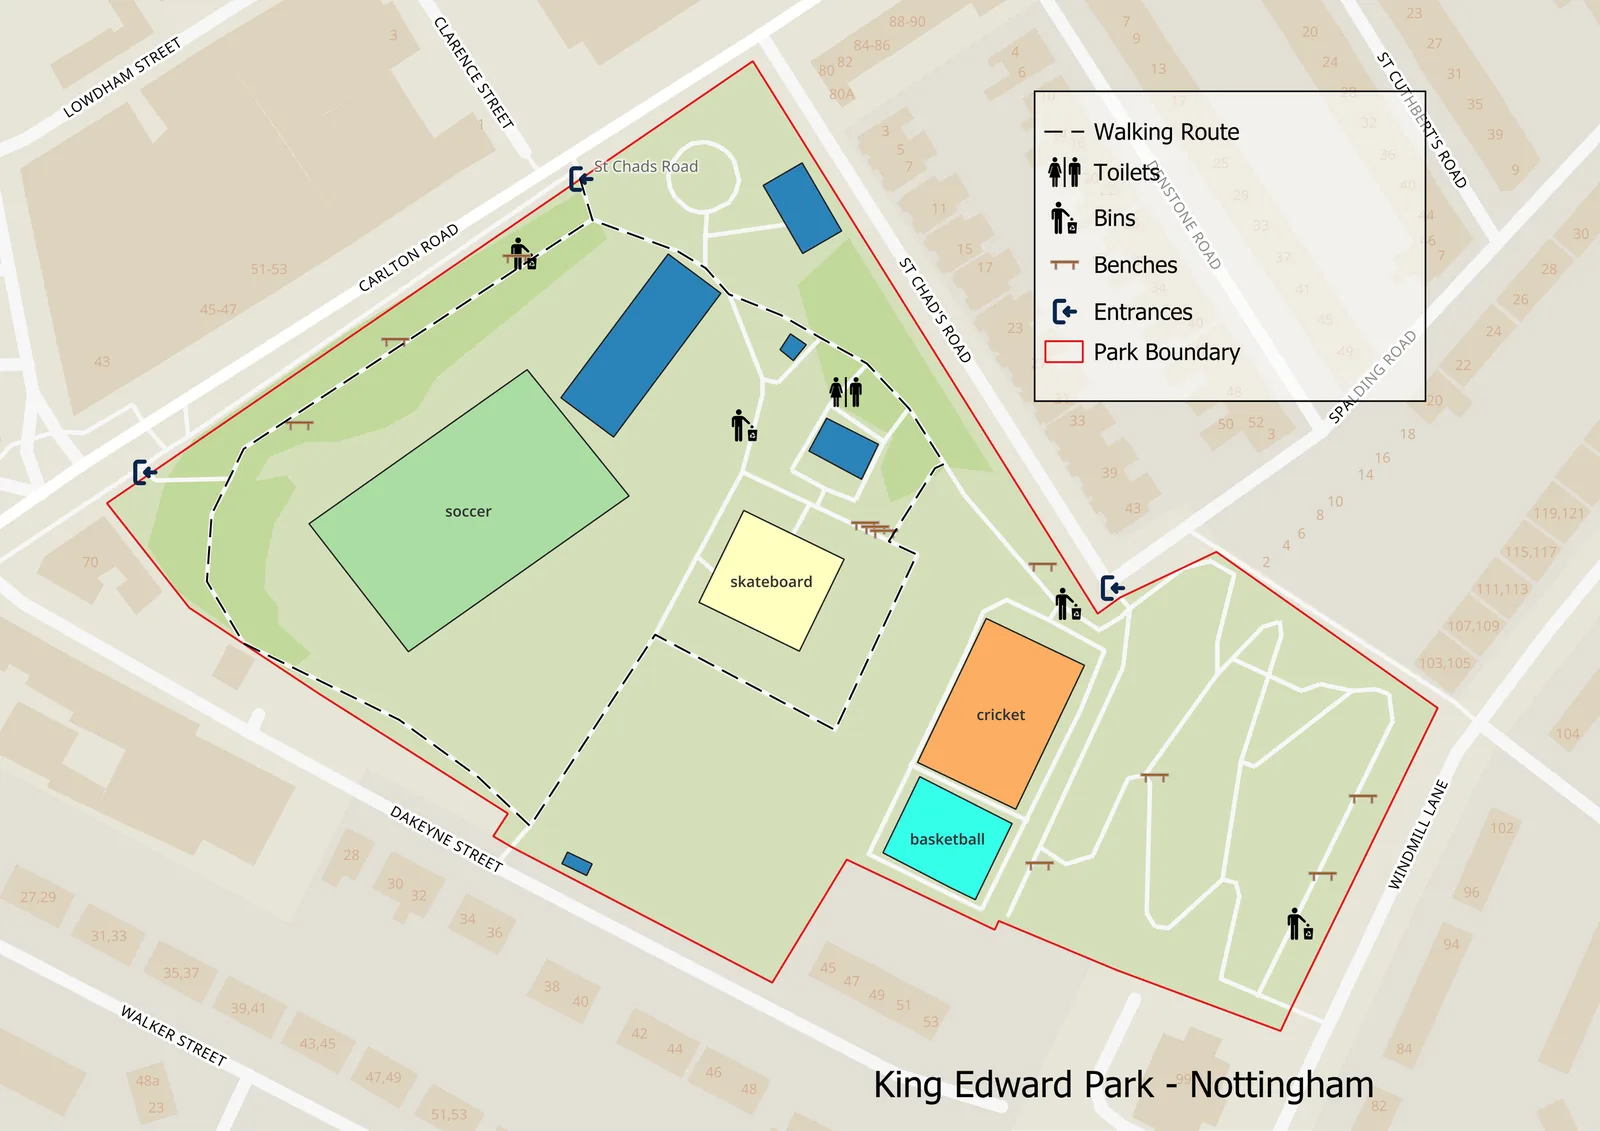
Map of King Edward Park, Nottingham, with the park boundary, sports areas, walking route, entrances, toilets, bins and benches
Tutorial26 Aug 2026

Auditing a city's cycle network with Mapillary and open source GIS

Pull the cycle network from OpenStreetMap, sweep Mapillary for street-level evidence, join the two, and rank what needs surveying. Run live over Nottingham's 259 km network, with the real numbers and the code.

In the works

Articles we are currently writing up from live project work. Want one of these sooner, or a topic that is not listed? Tell us and we will prioritise it.

  • Case StudyMethane Emissions Mapping with Satellite Data
  • TutorialGetting Started with Mergin Maps for Field Data Collection
  • GuideDrone Mapping for Construction: From Flight to Deliverable
  • OpinionWhy Open Source GIS is Ready for Enterprise